Meet ✨geom_valley✨
I started writing this script at the end of 2021, inspired by The Ringer series by Dmitri Cherniak and Thomas Lin Pedersen’s Constructive collection.
I was back home in sunny Wales and set about trying to use a series of random choices to produce a cartoon landscape. I make a lot of data visualisations in R and it occurred to me that I could use ggplot functions if I just consider components of the image in terms of points along two axes. I’d then add some leeway along those axes to include some variation during multiple iterations. Admittedly, I haven’t worked on this in a good while but eventually I settled on the very messy R script I call geom_valley. How does it work?
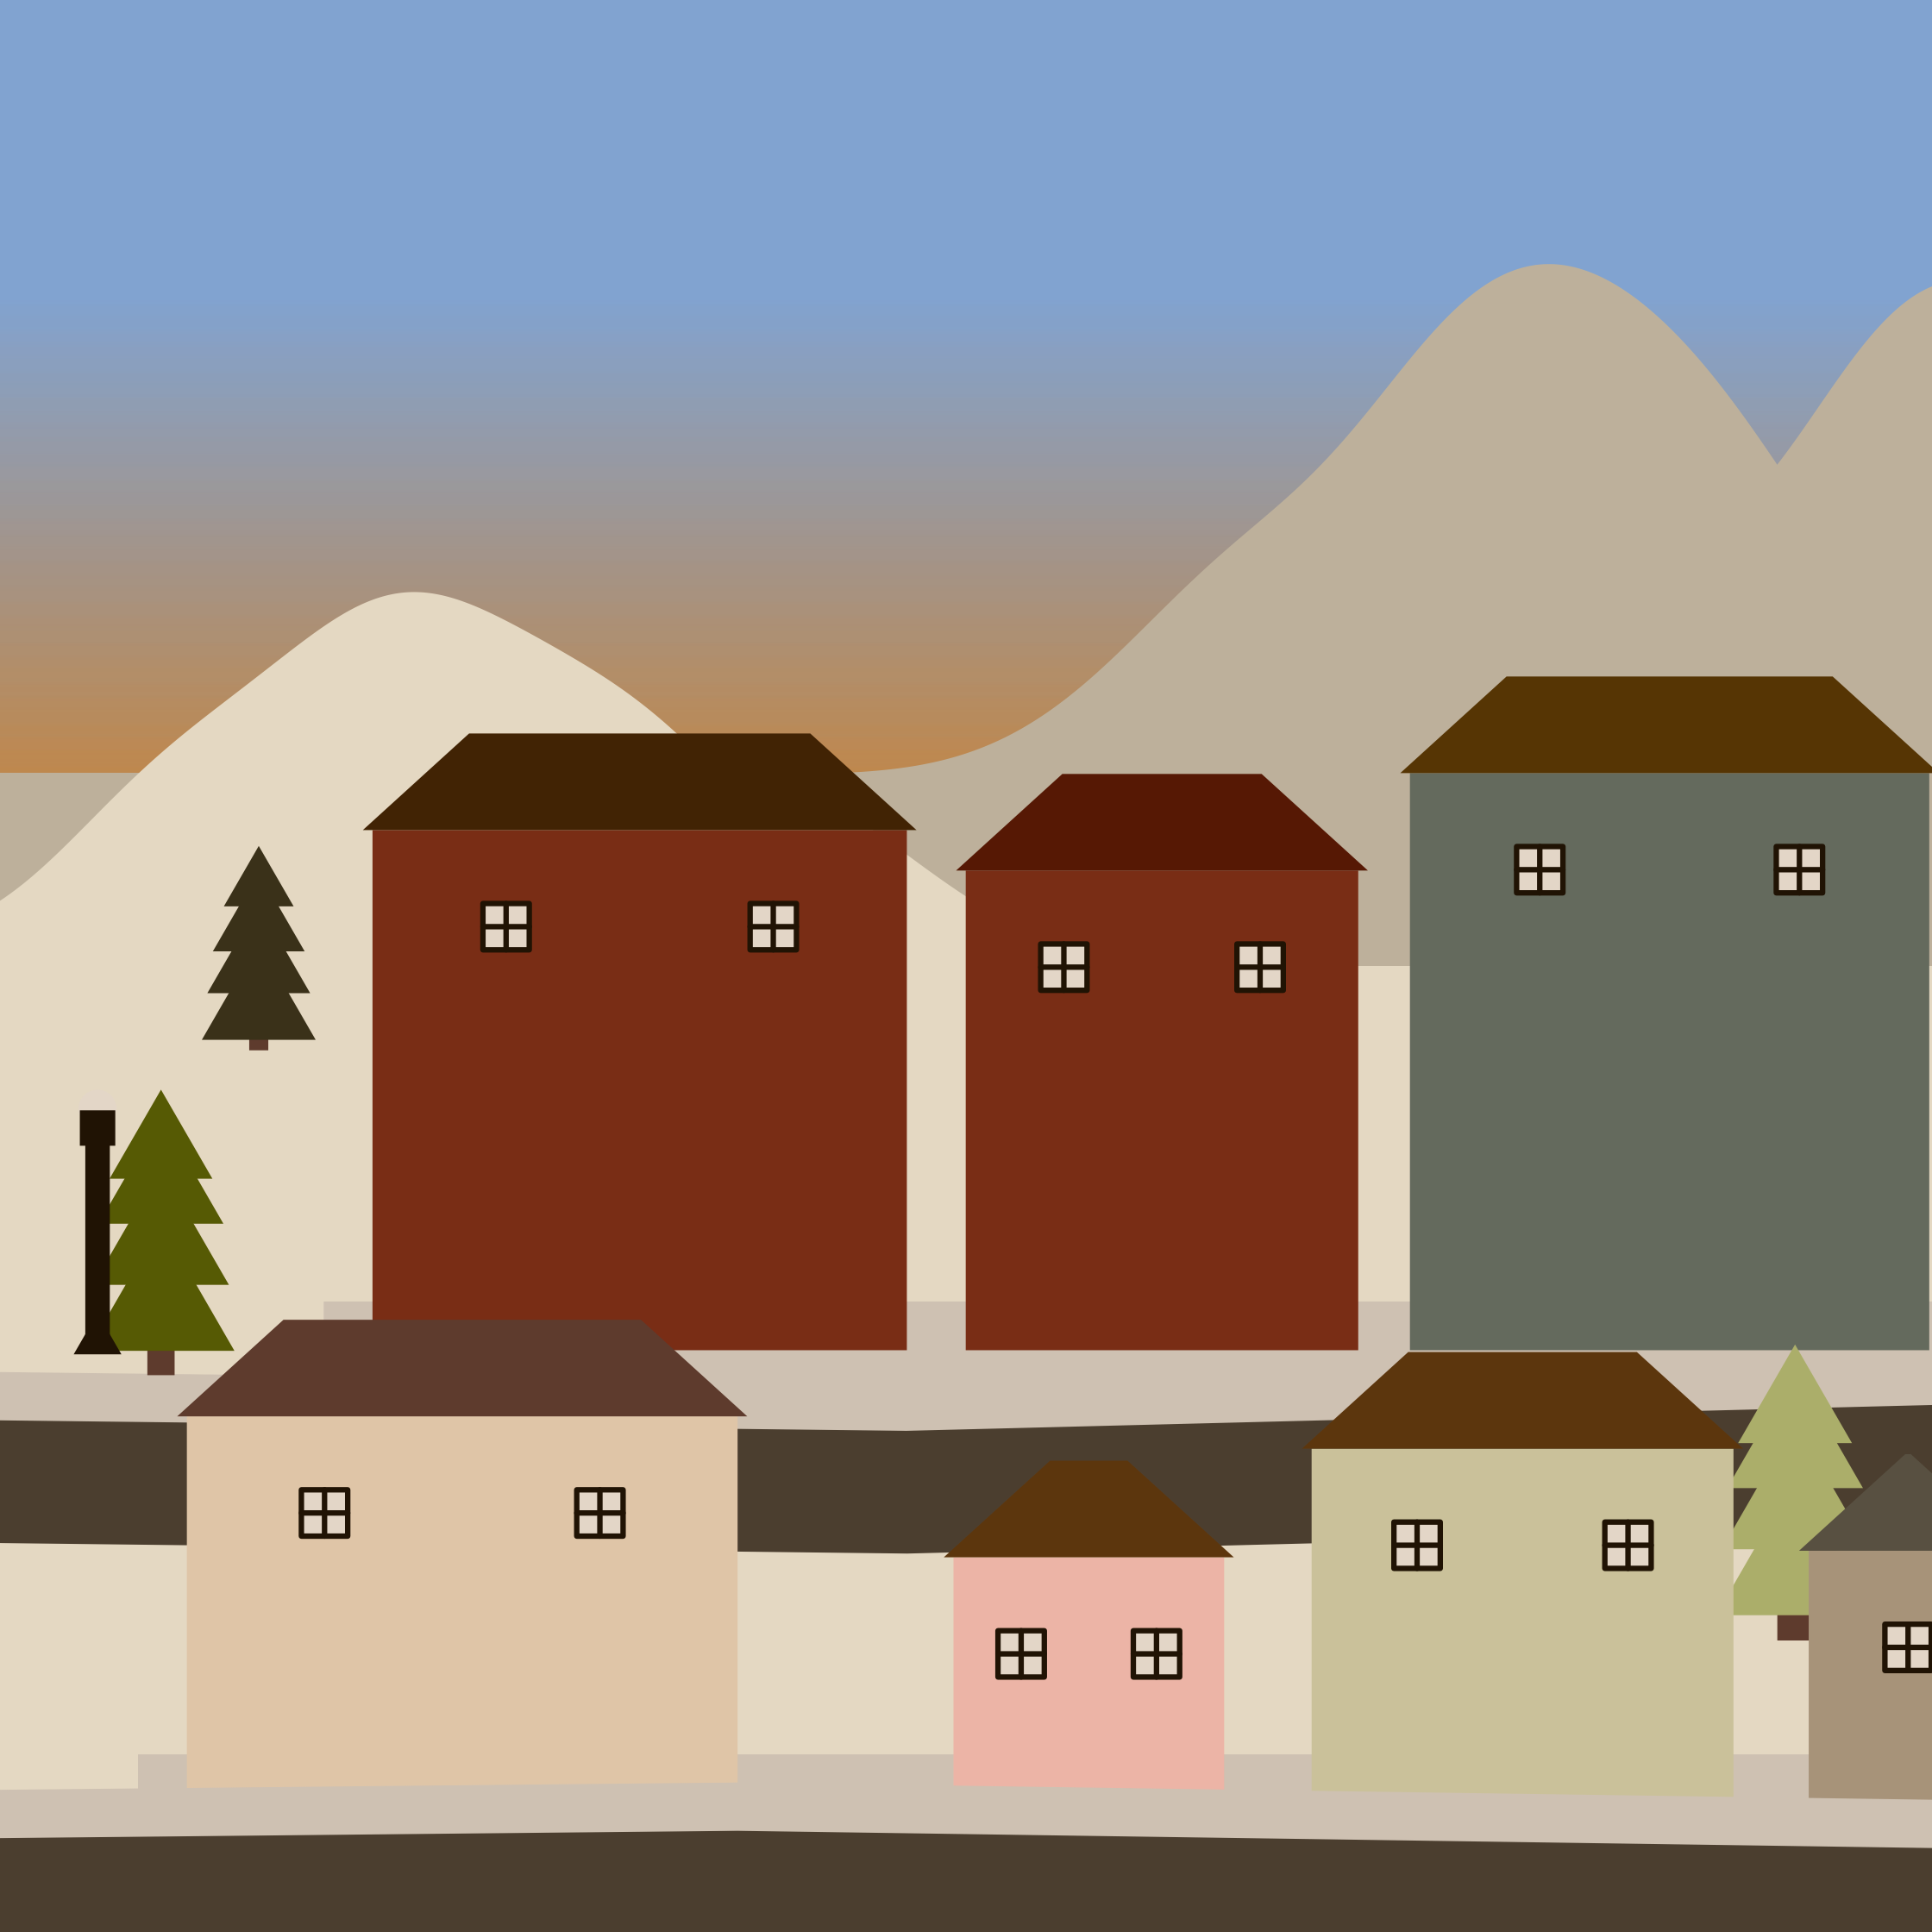
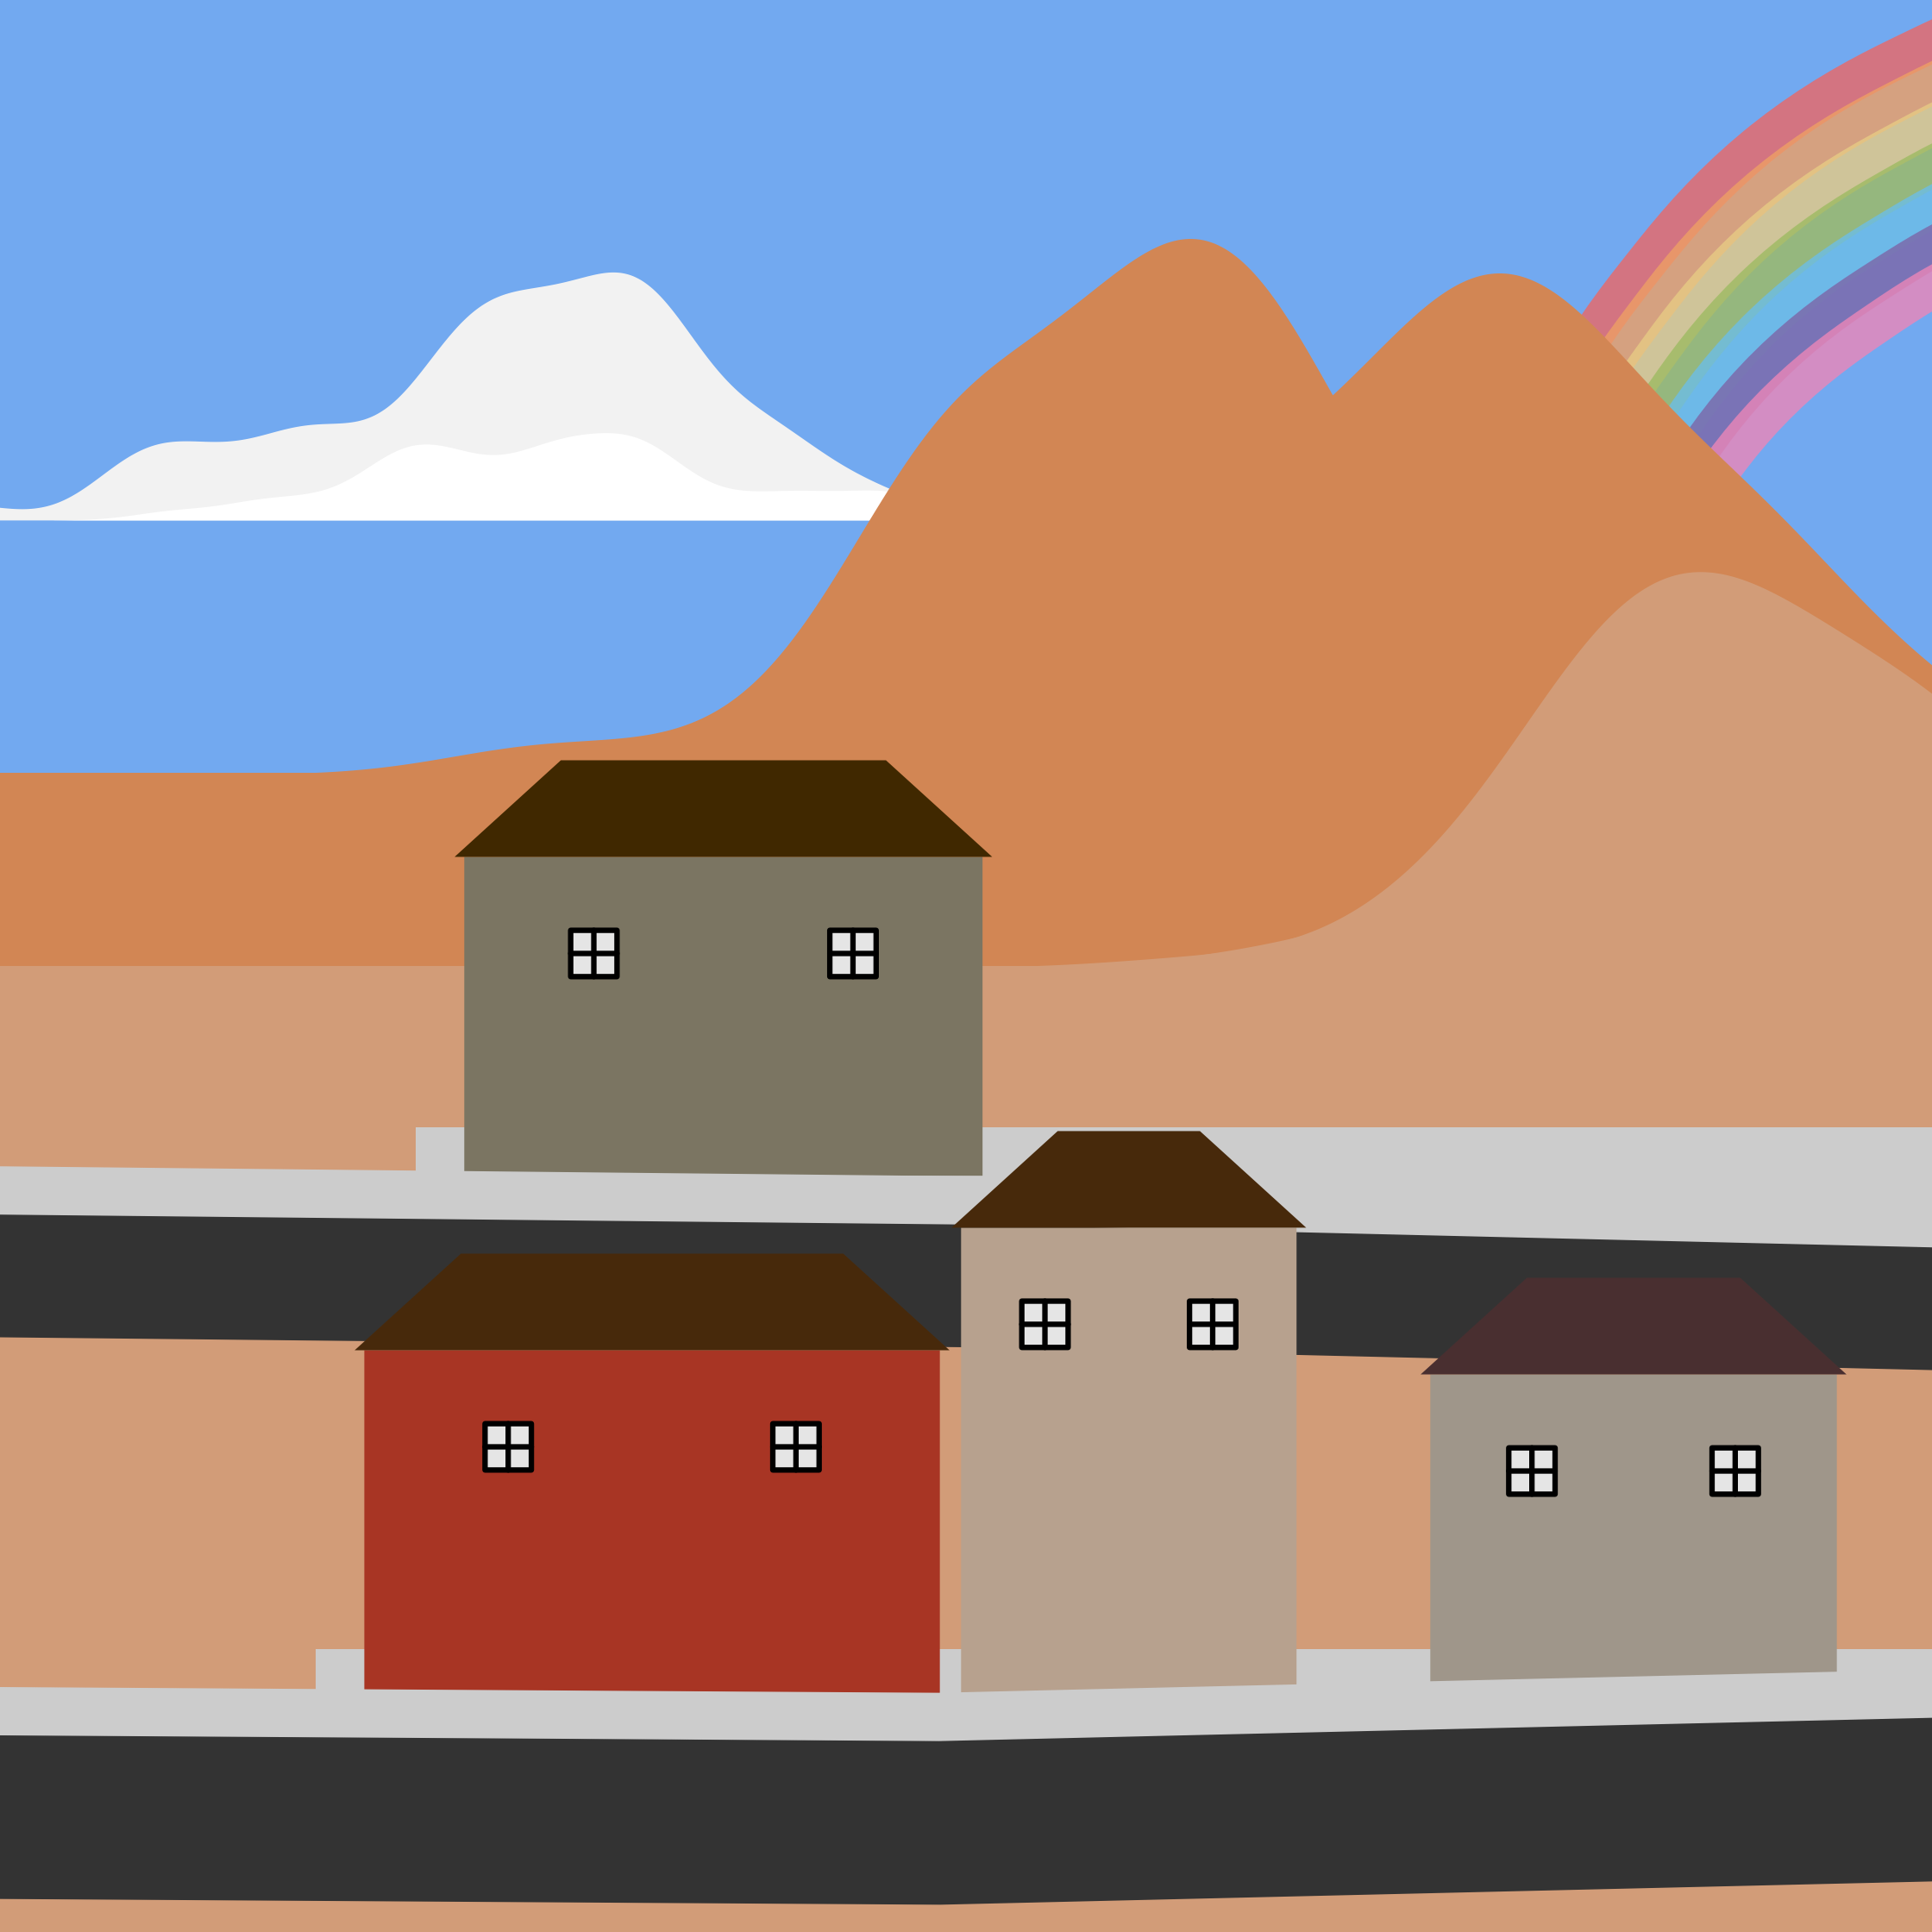
Firstly, geom_valley chooses one of three landscapes (grass, snow, desert) and a time variable that determines night and day. The mountains and clouds are simply kernal density plots.
  #Day sky
    {if(time >=6 & time<22) geom_rect(
      aes(
      xmin = 0,
      xmax = 10,
      ymin = 0,
      ymax = 10
    ),
    fill = "#72A9F0")}+
  #Night sky
  {if(time >=22 | time<6) geom_rect(
    aes(
    xmin = 0,
    xmax = 10,
    ymin = 0,
    ymax = 10
  ),
  fill = "#0e1a29")}+
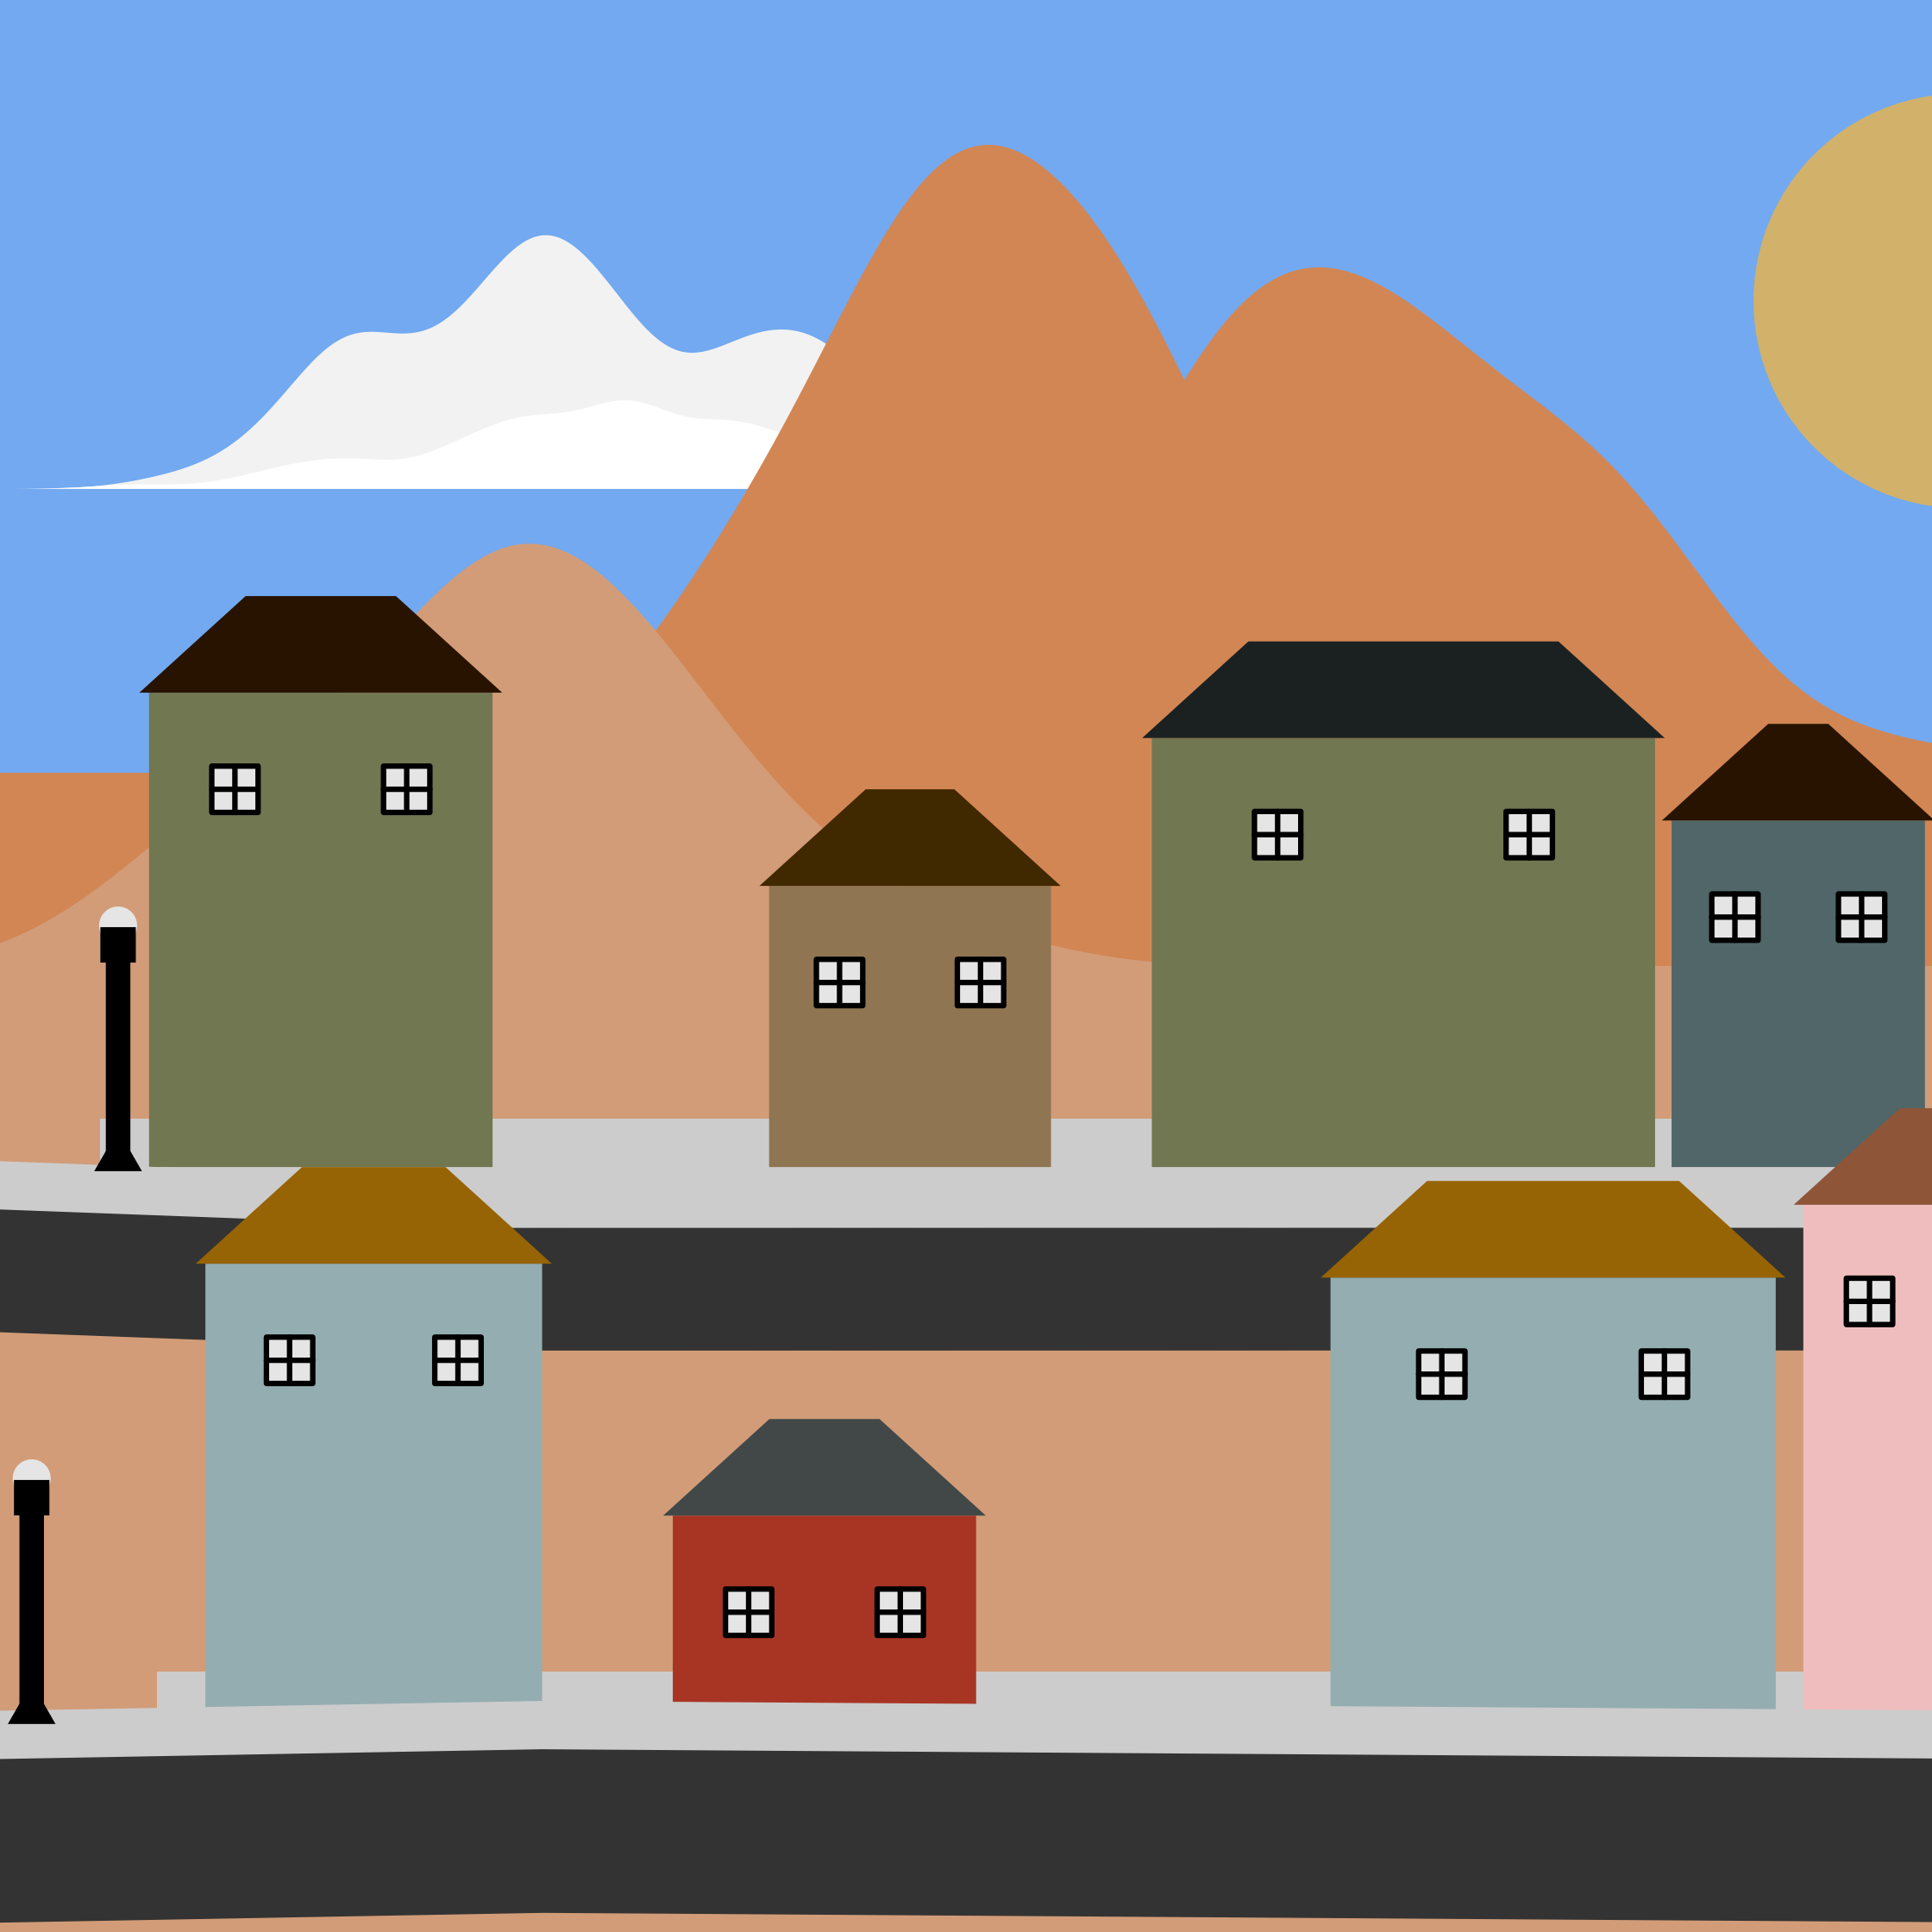
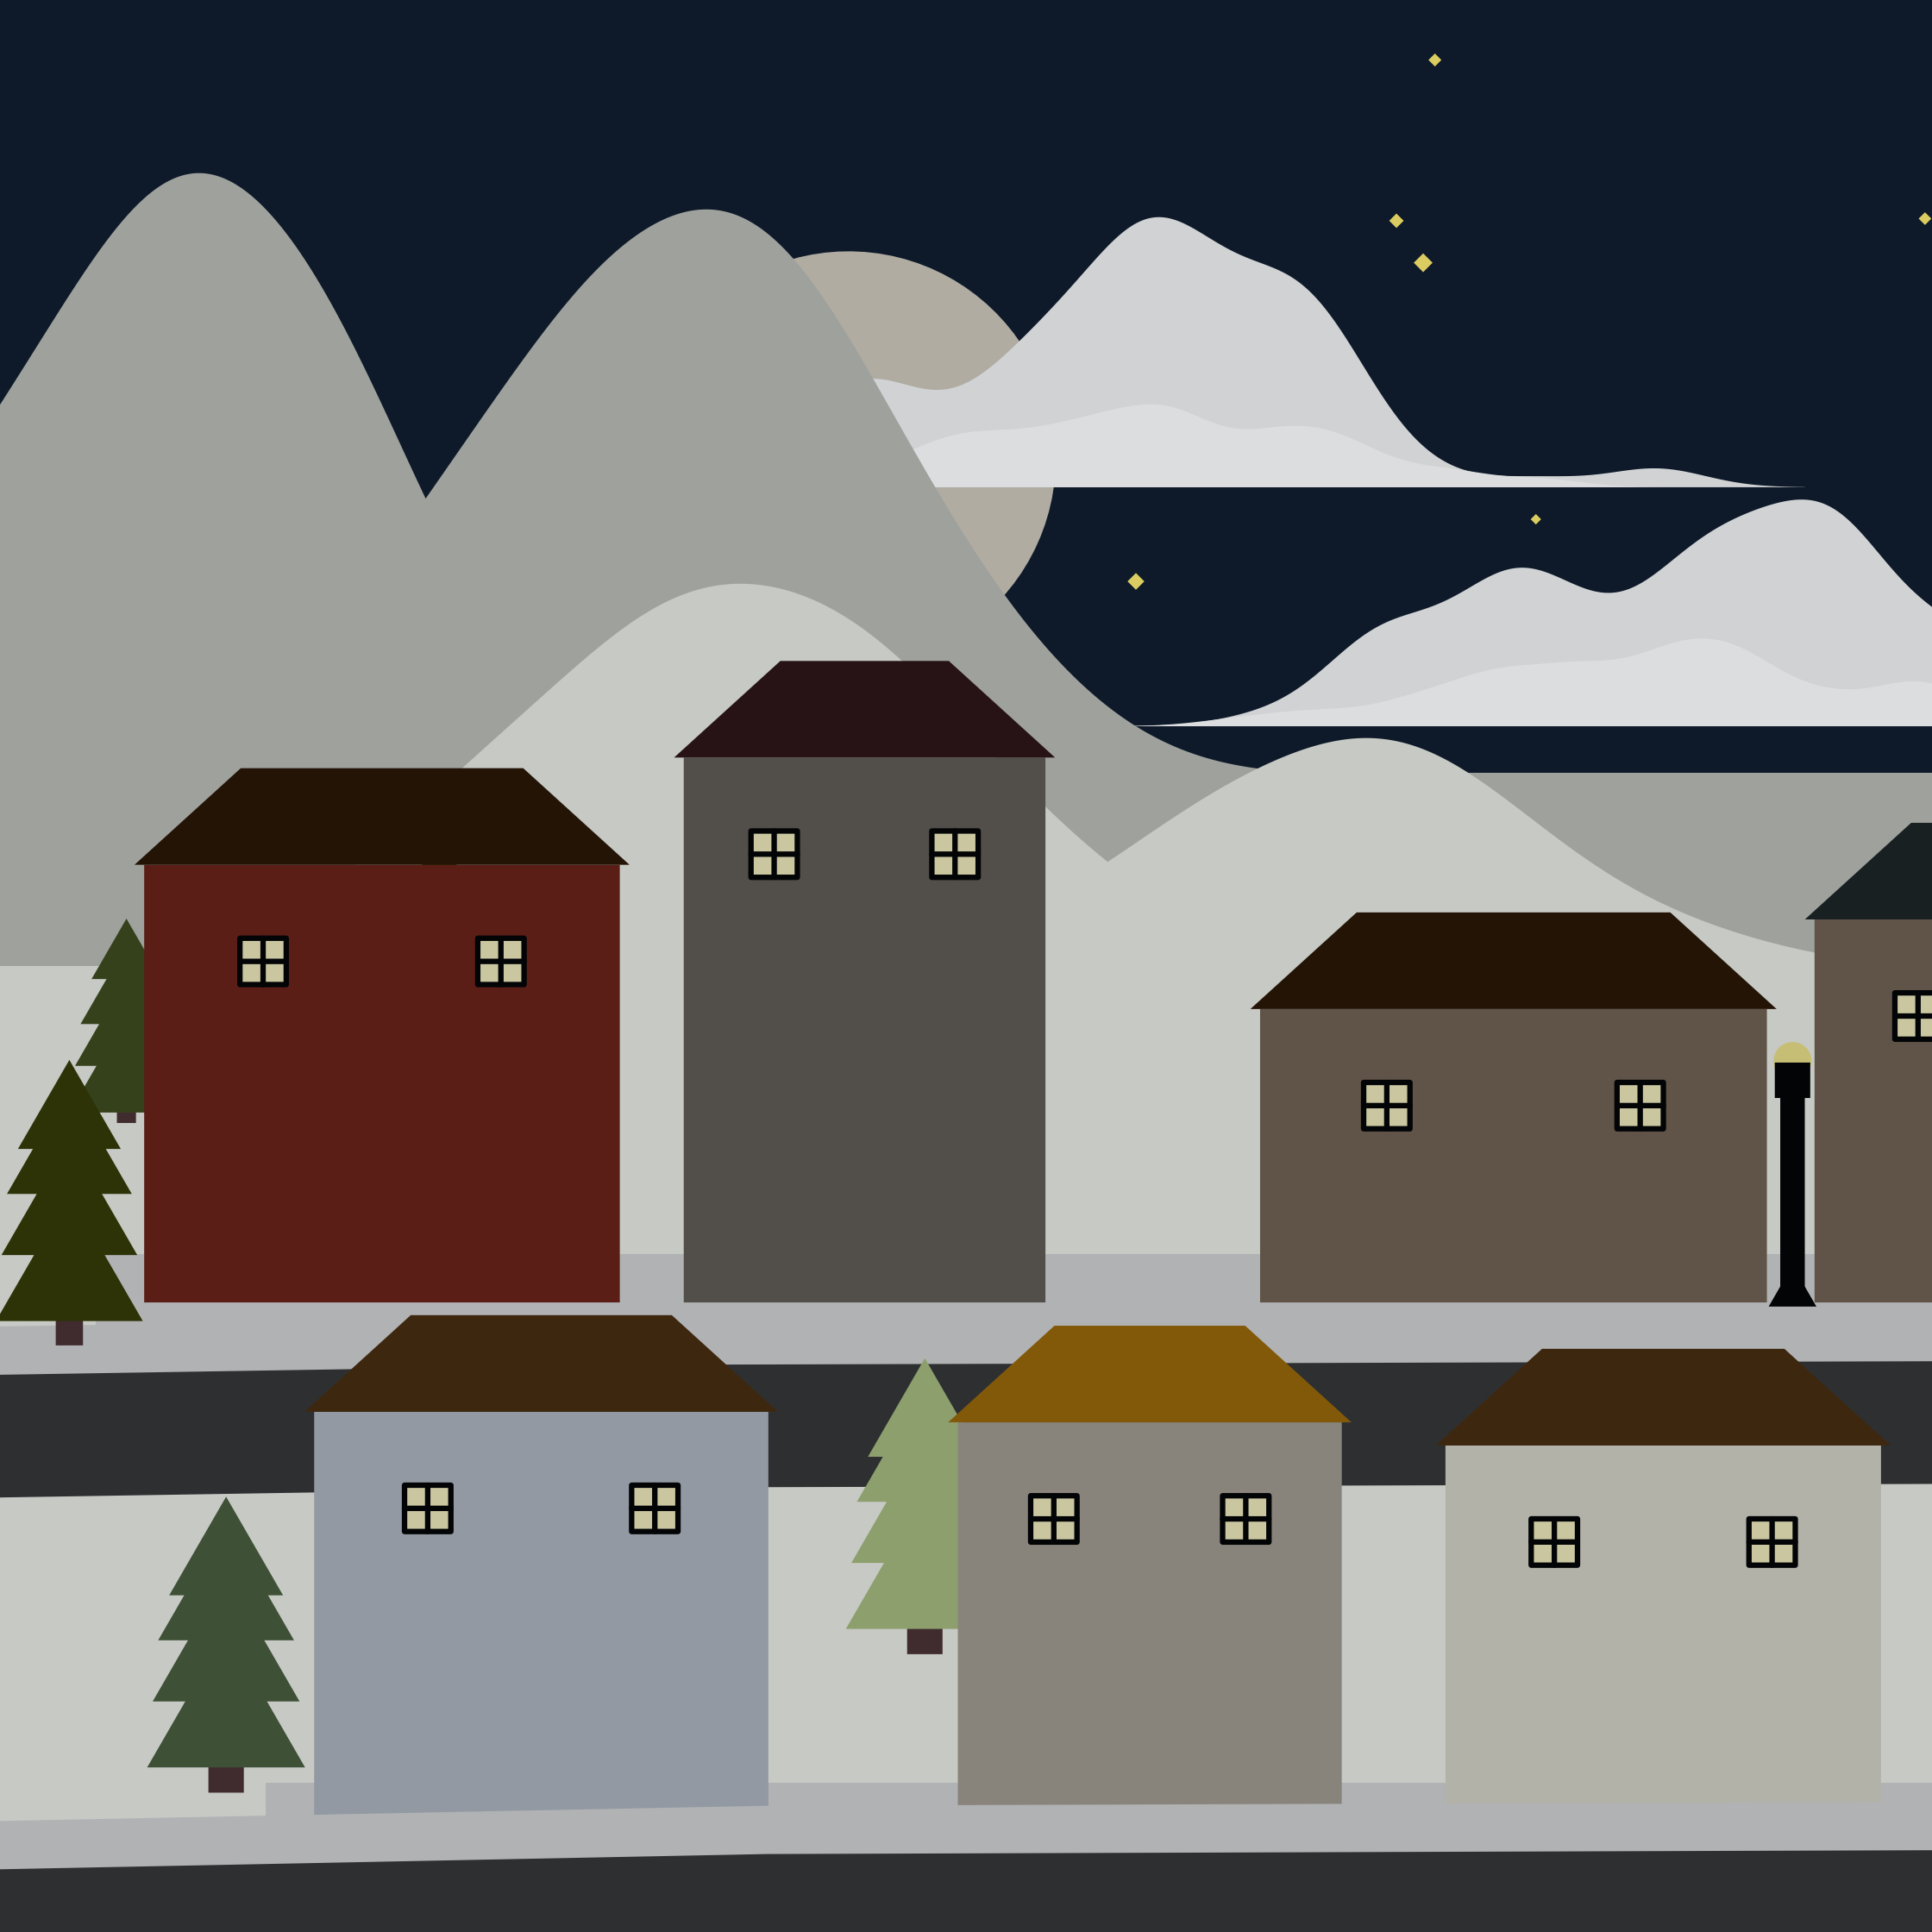
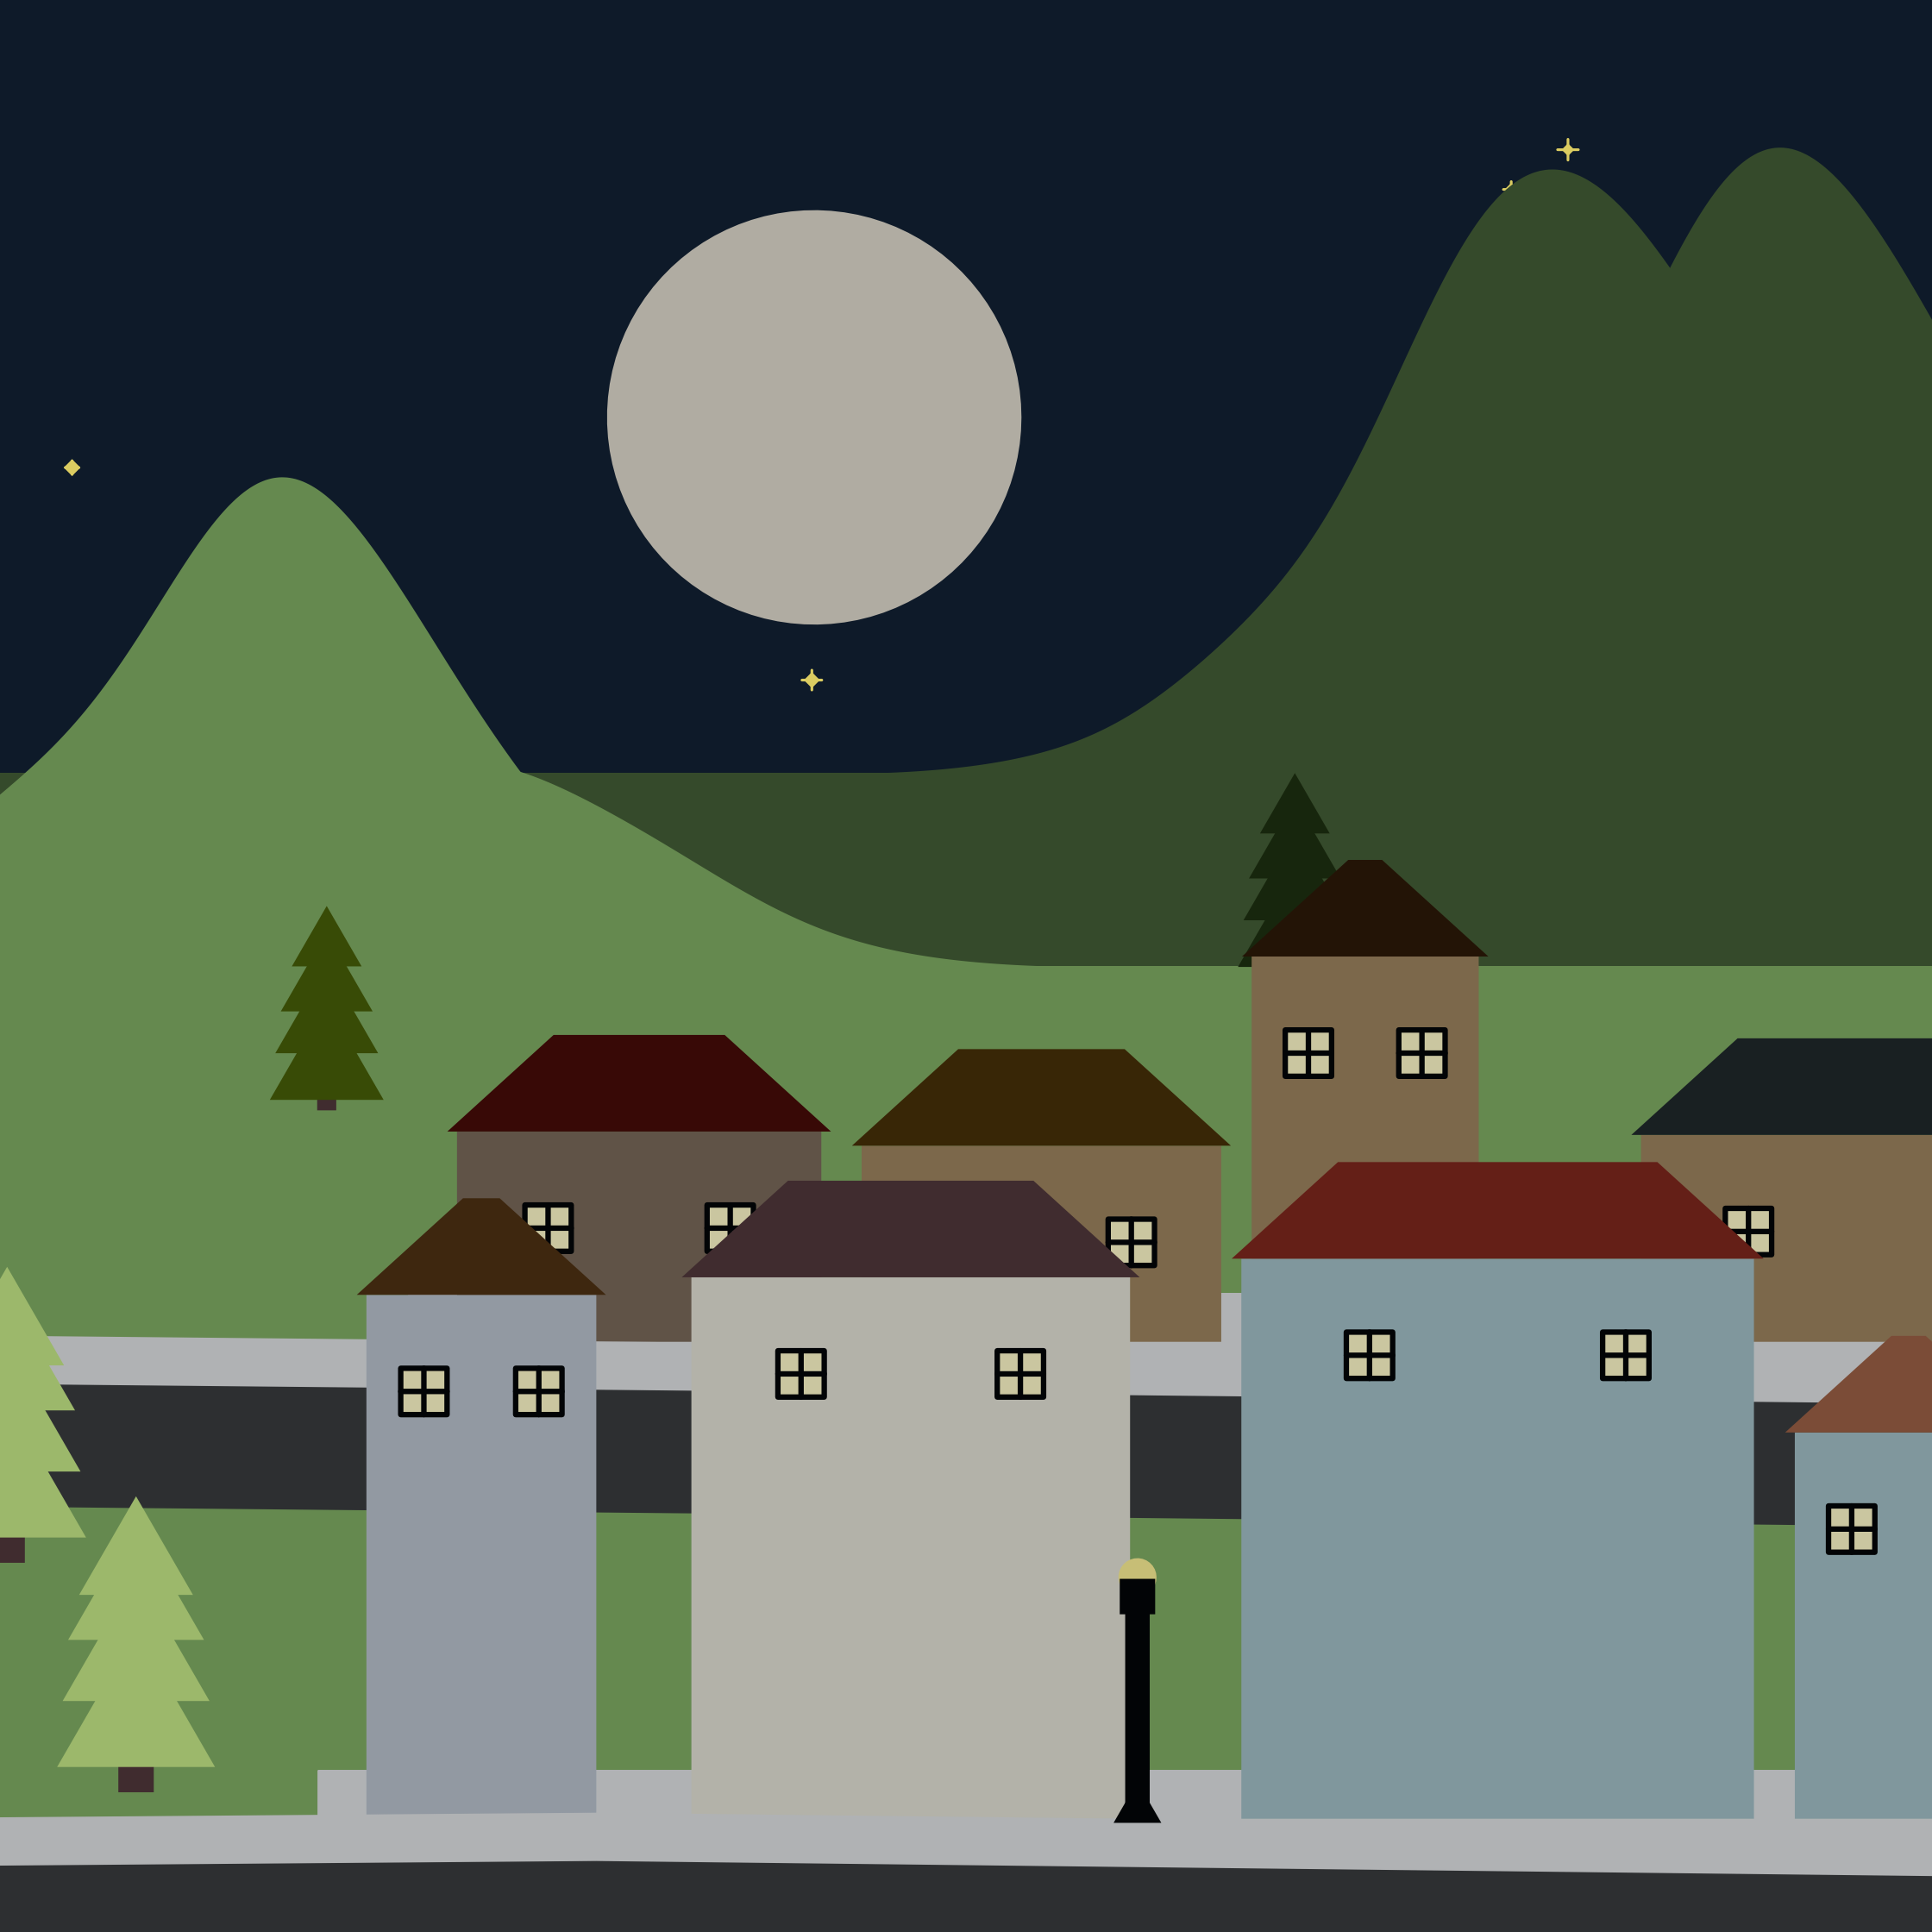
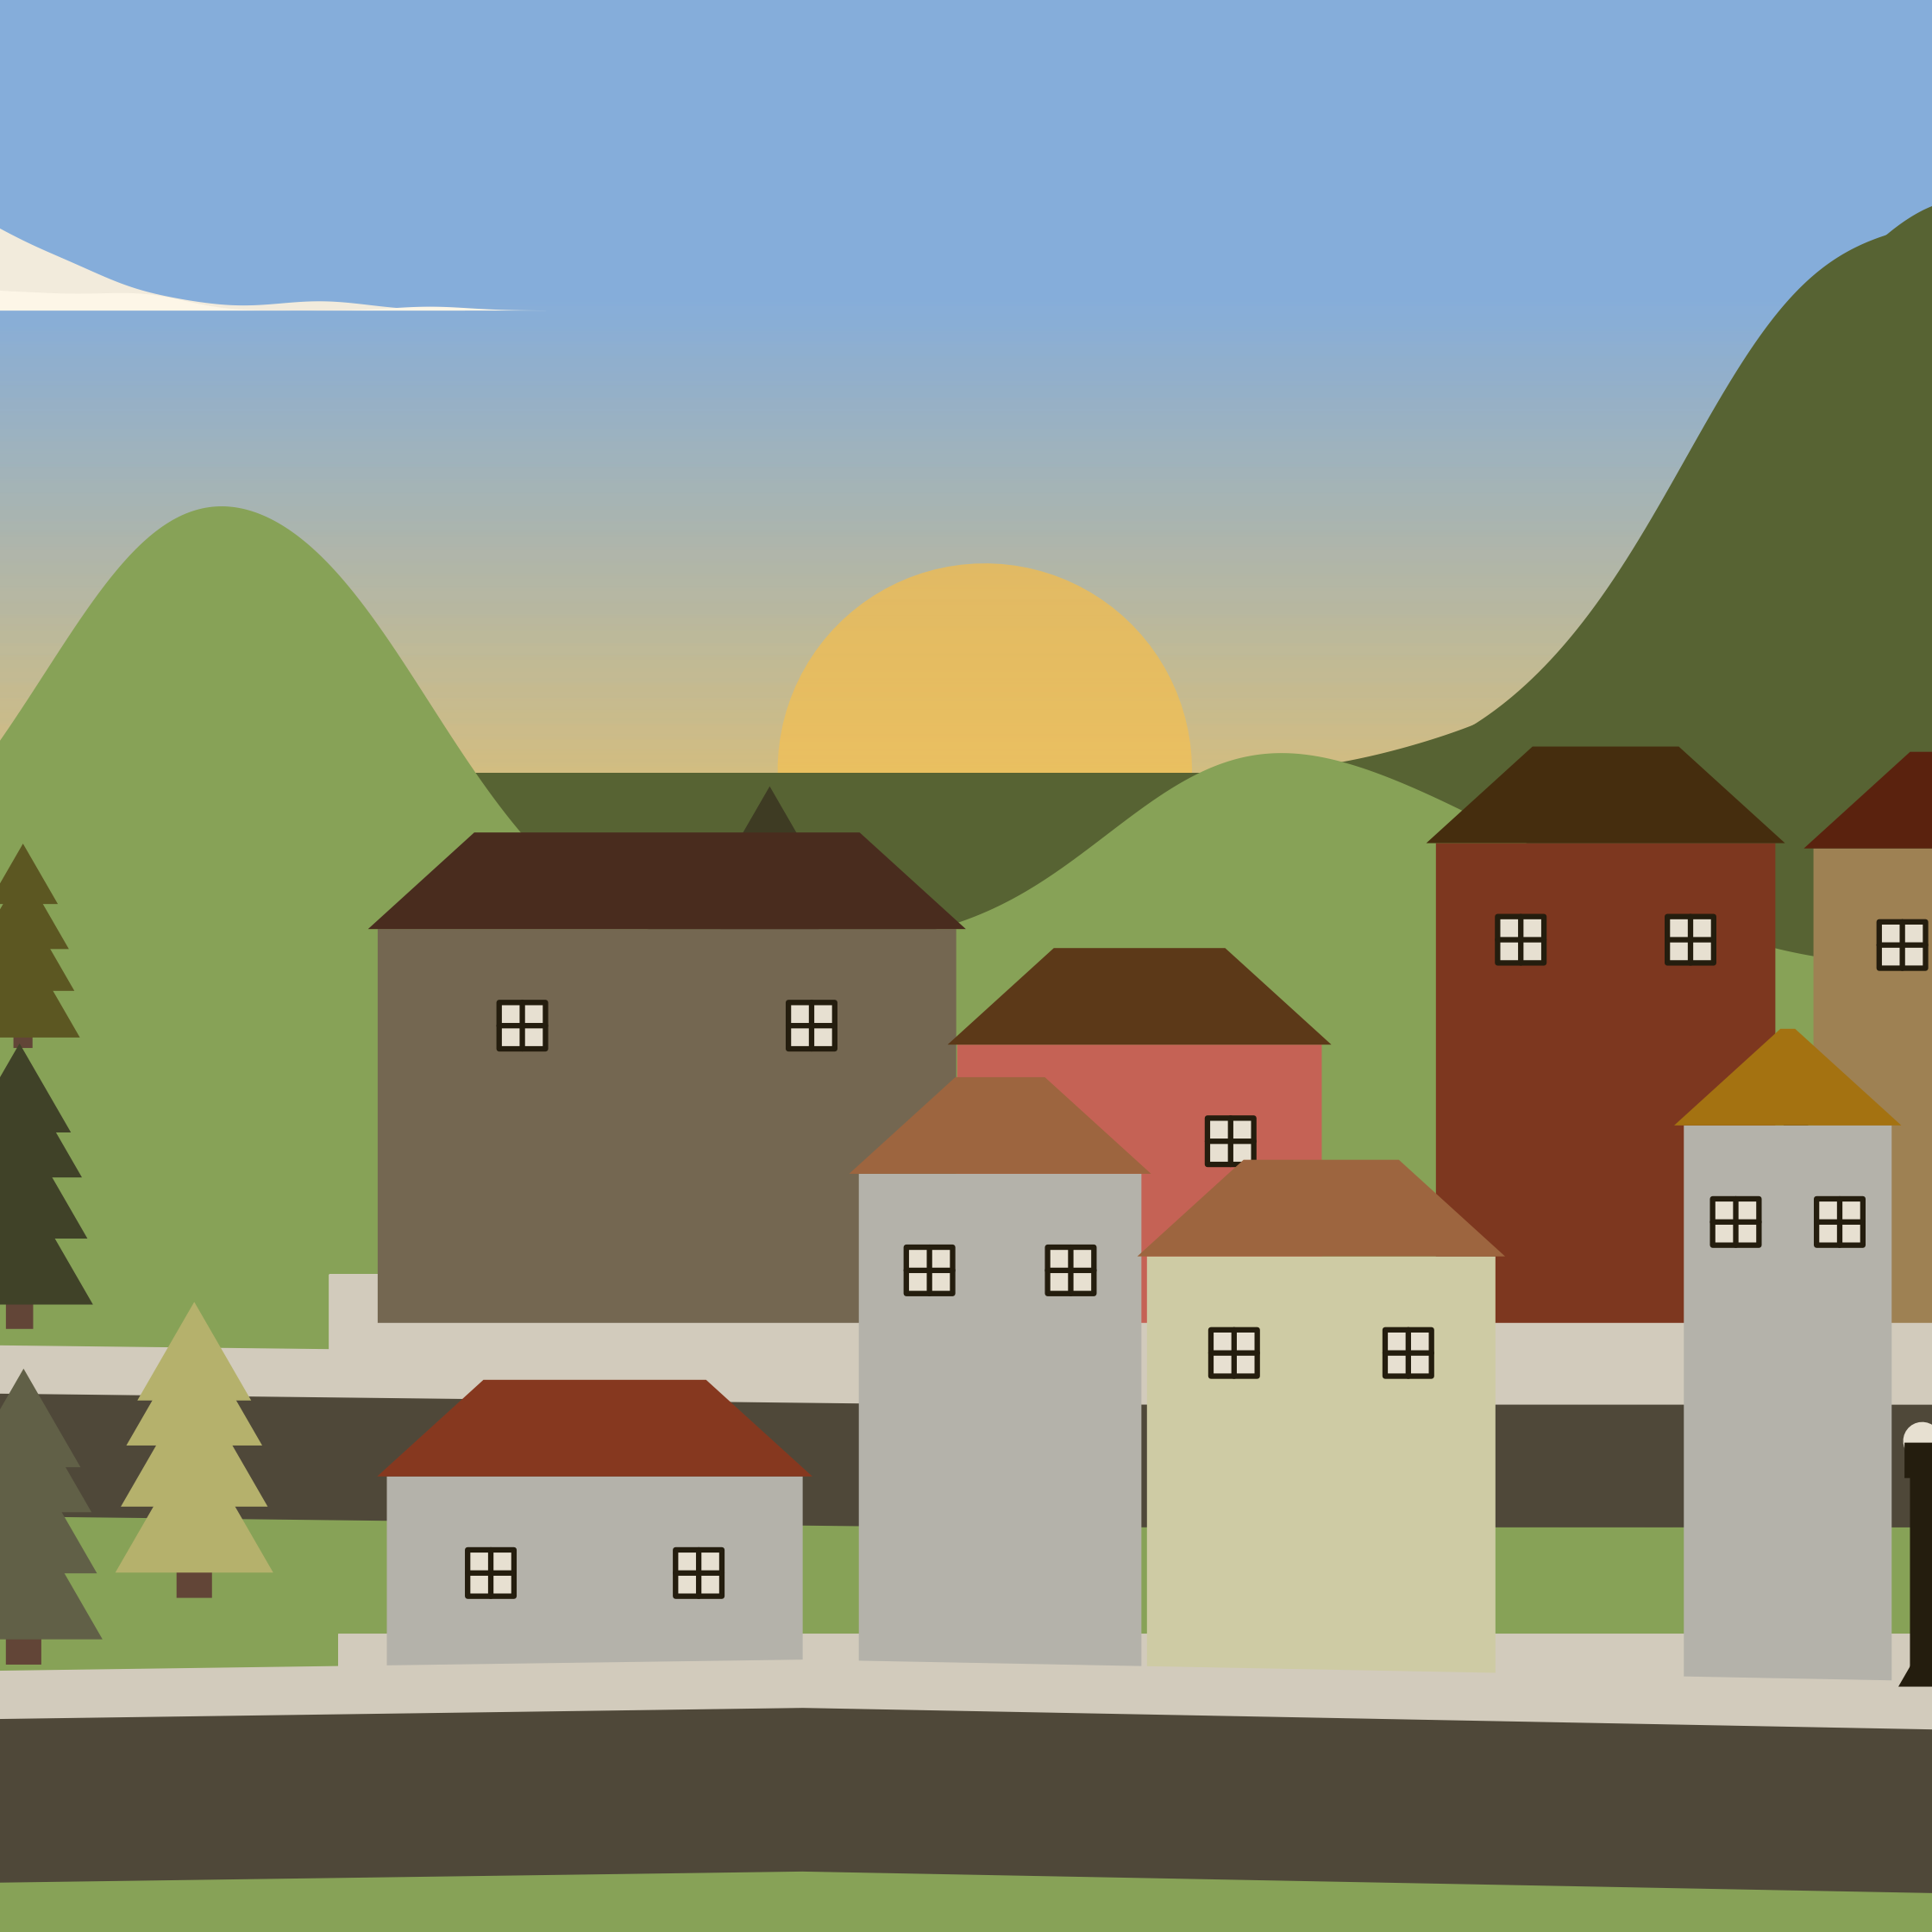
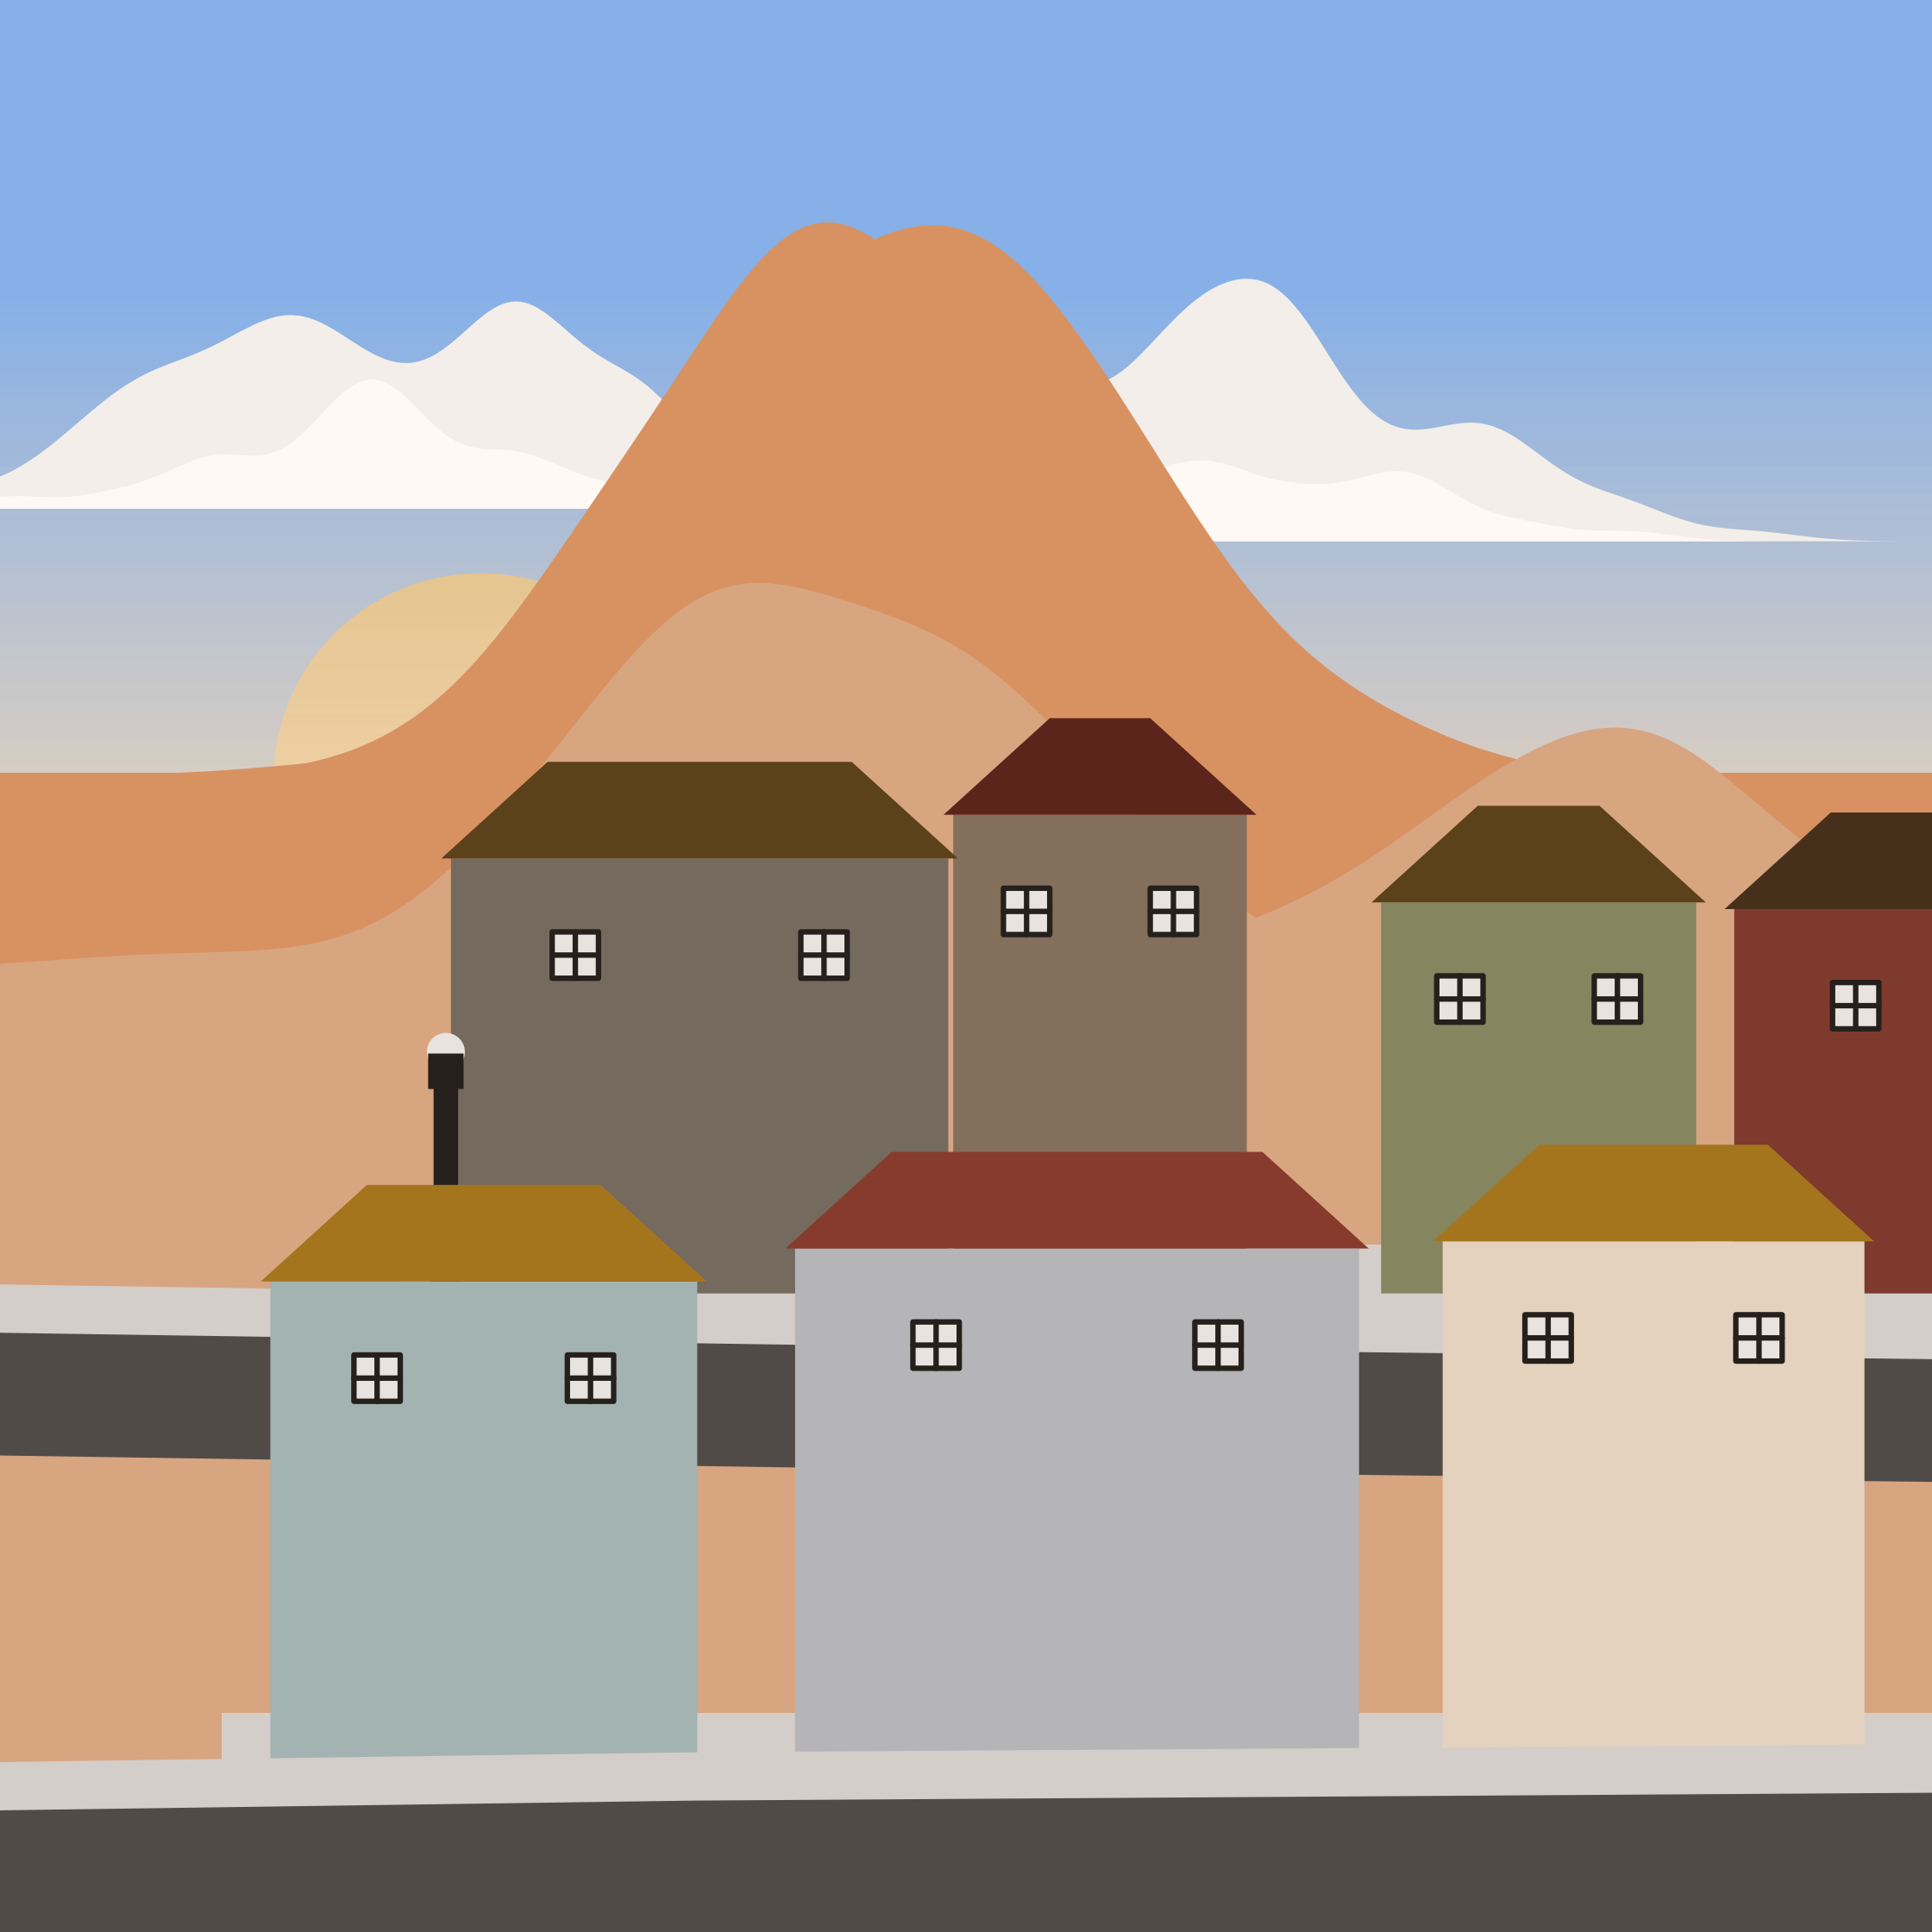
The time variable, along with the position of the sun, then determines whether there will be a sunrise or sunset.
#Sunrise
  {if(time >=6 & time<13 & suny < 6.5 & suny > 5 & sunx <10 & sunx >0)
    with_blur(
      geom_rect(
    data=rect_grad,
              aes(xmin=0,
                  xmax=10,
                  ymin=ymin,
                  ymax=ymax,
                  alpha=alpha),
              fill=rand.pal.sunrise,
    colour=NA),
    sigma=3)} +
  scale_alpha_identity()
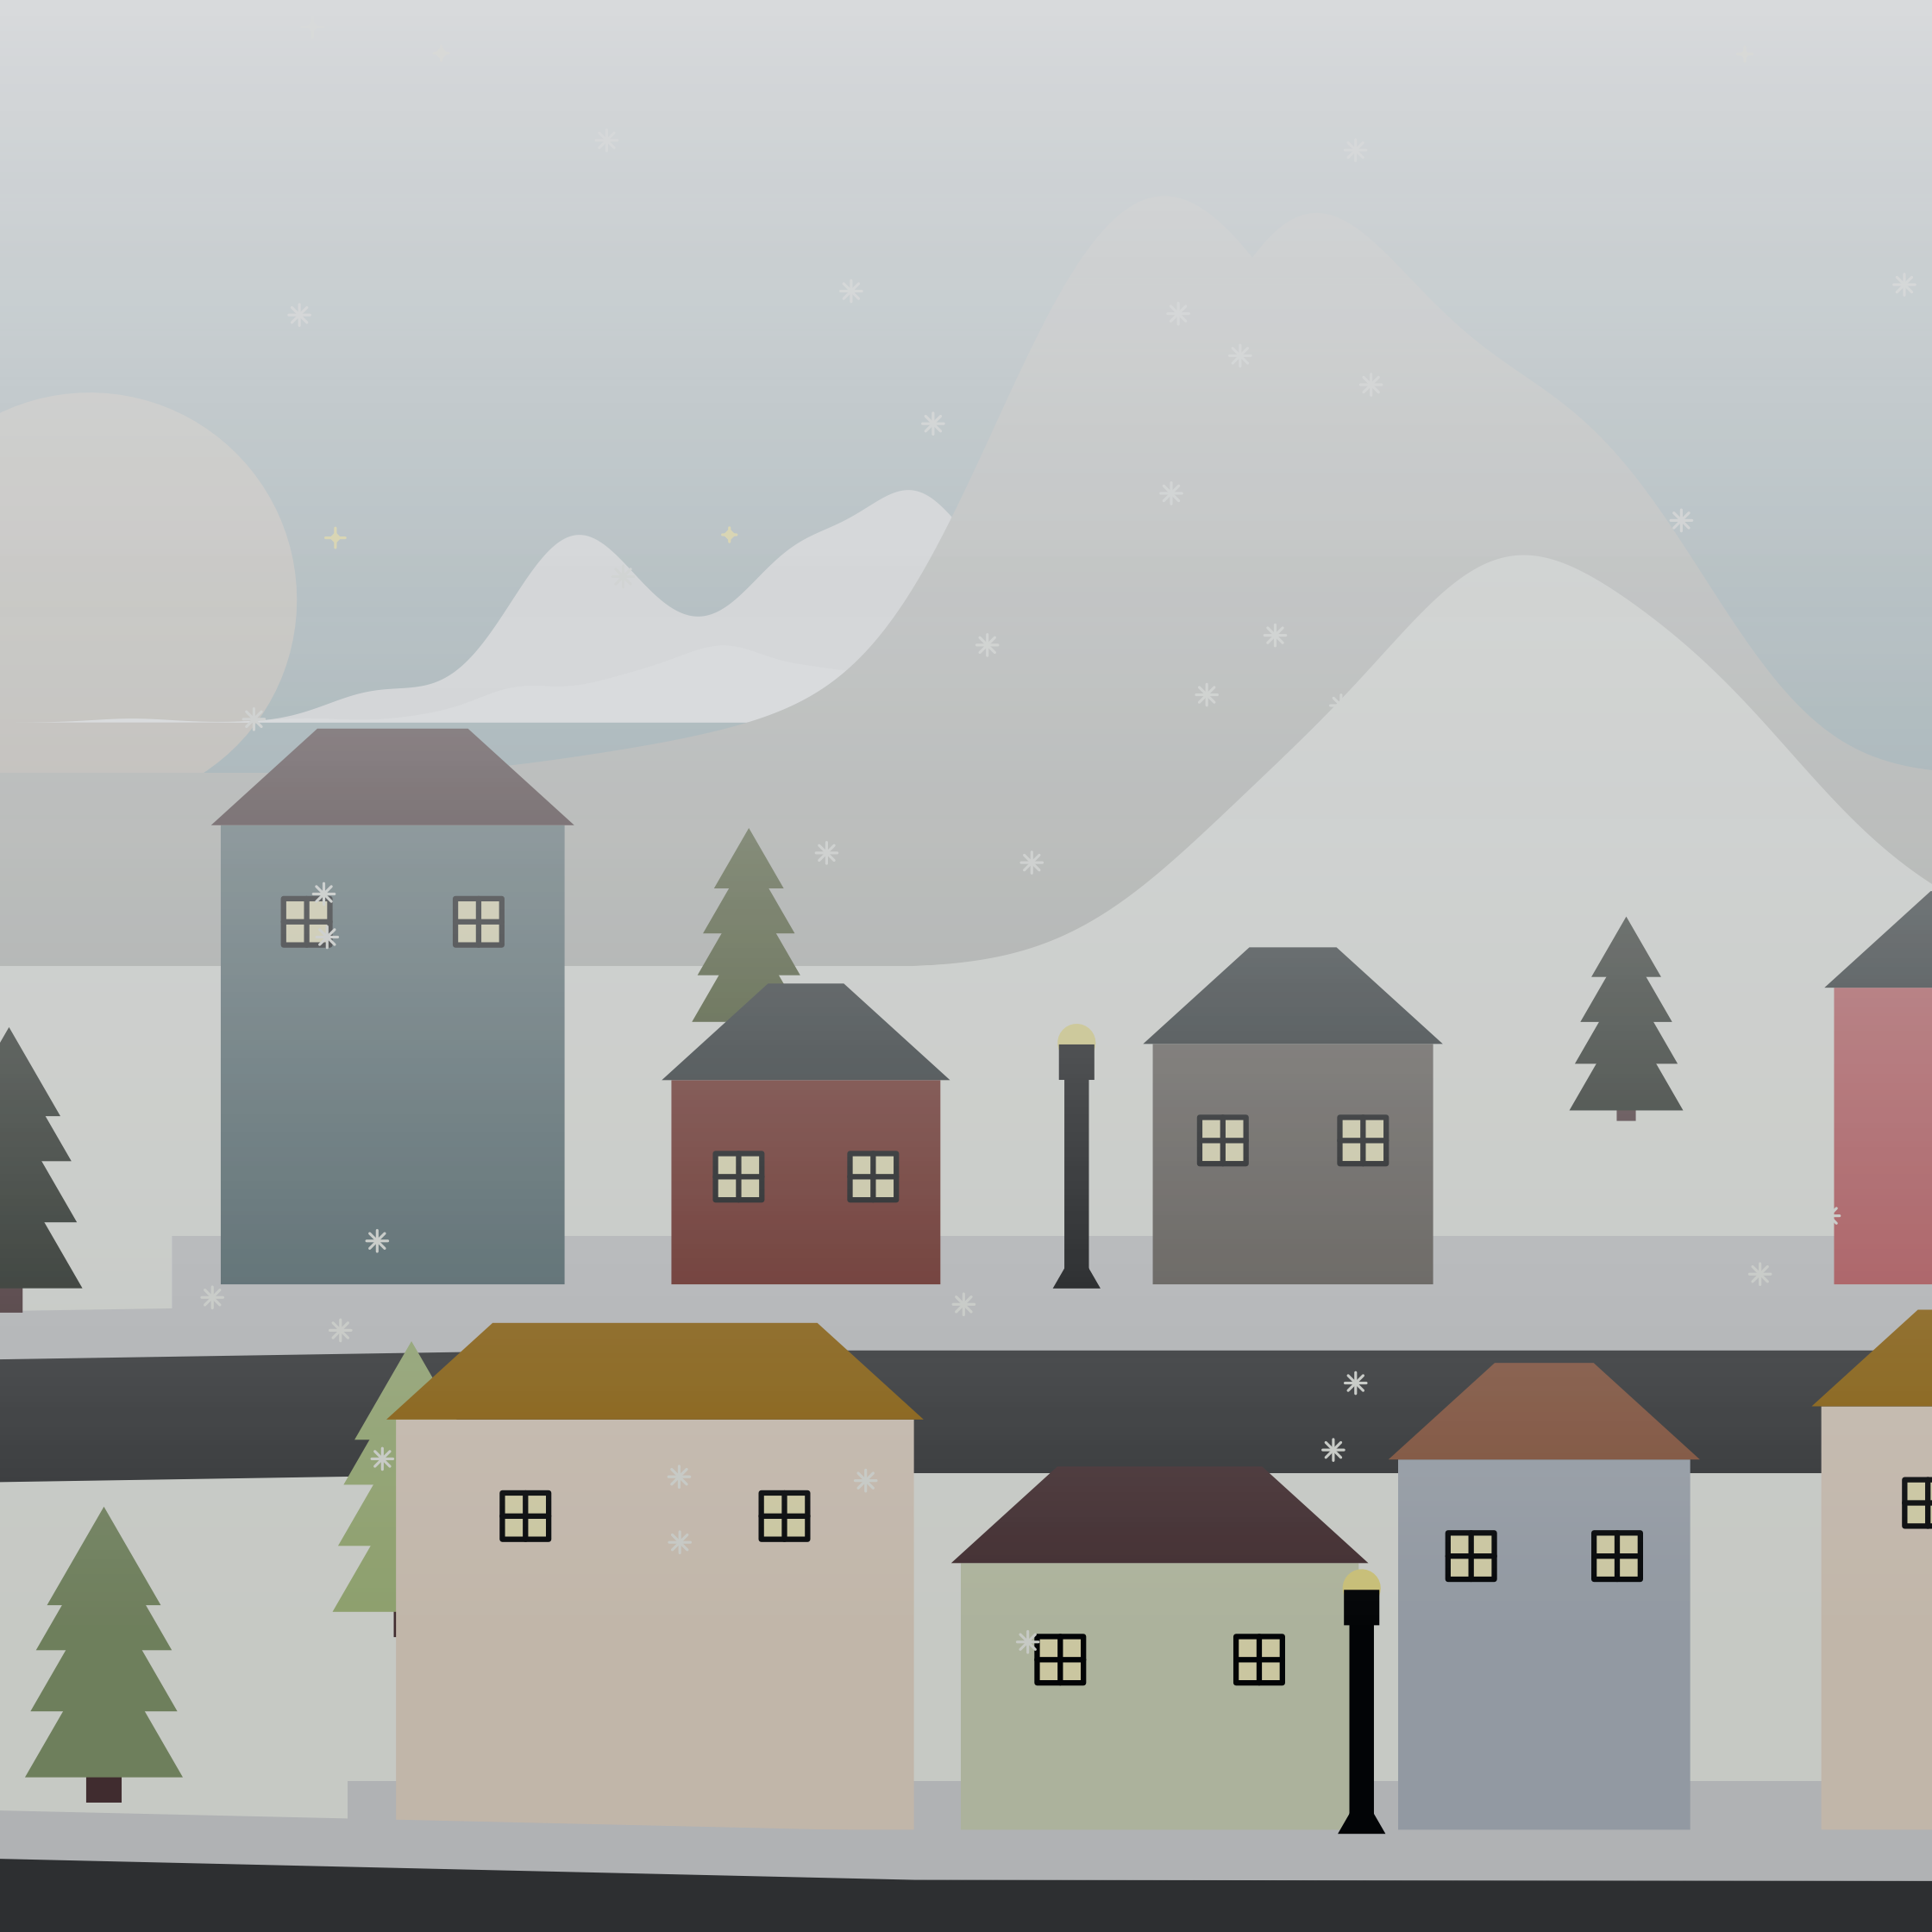
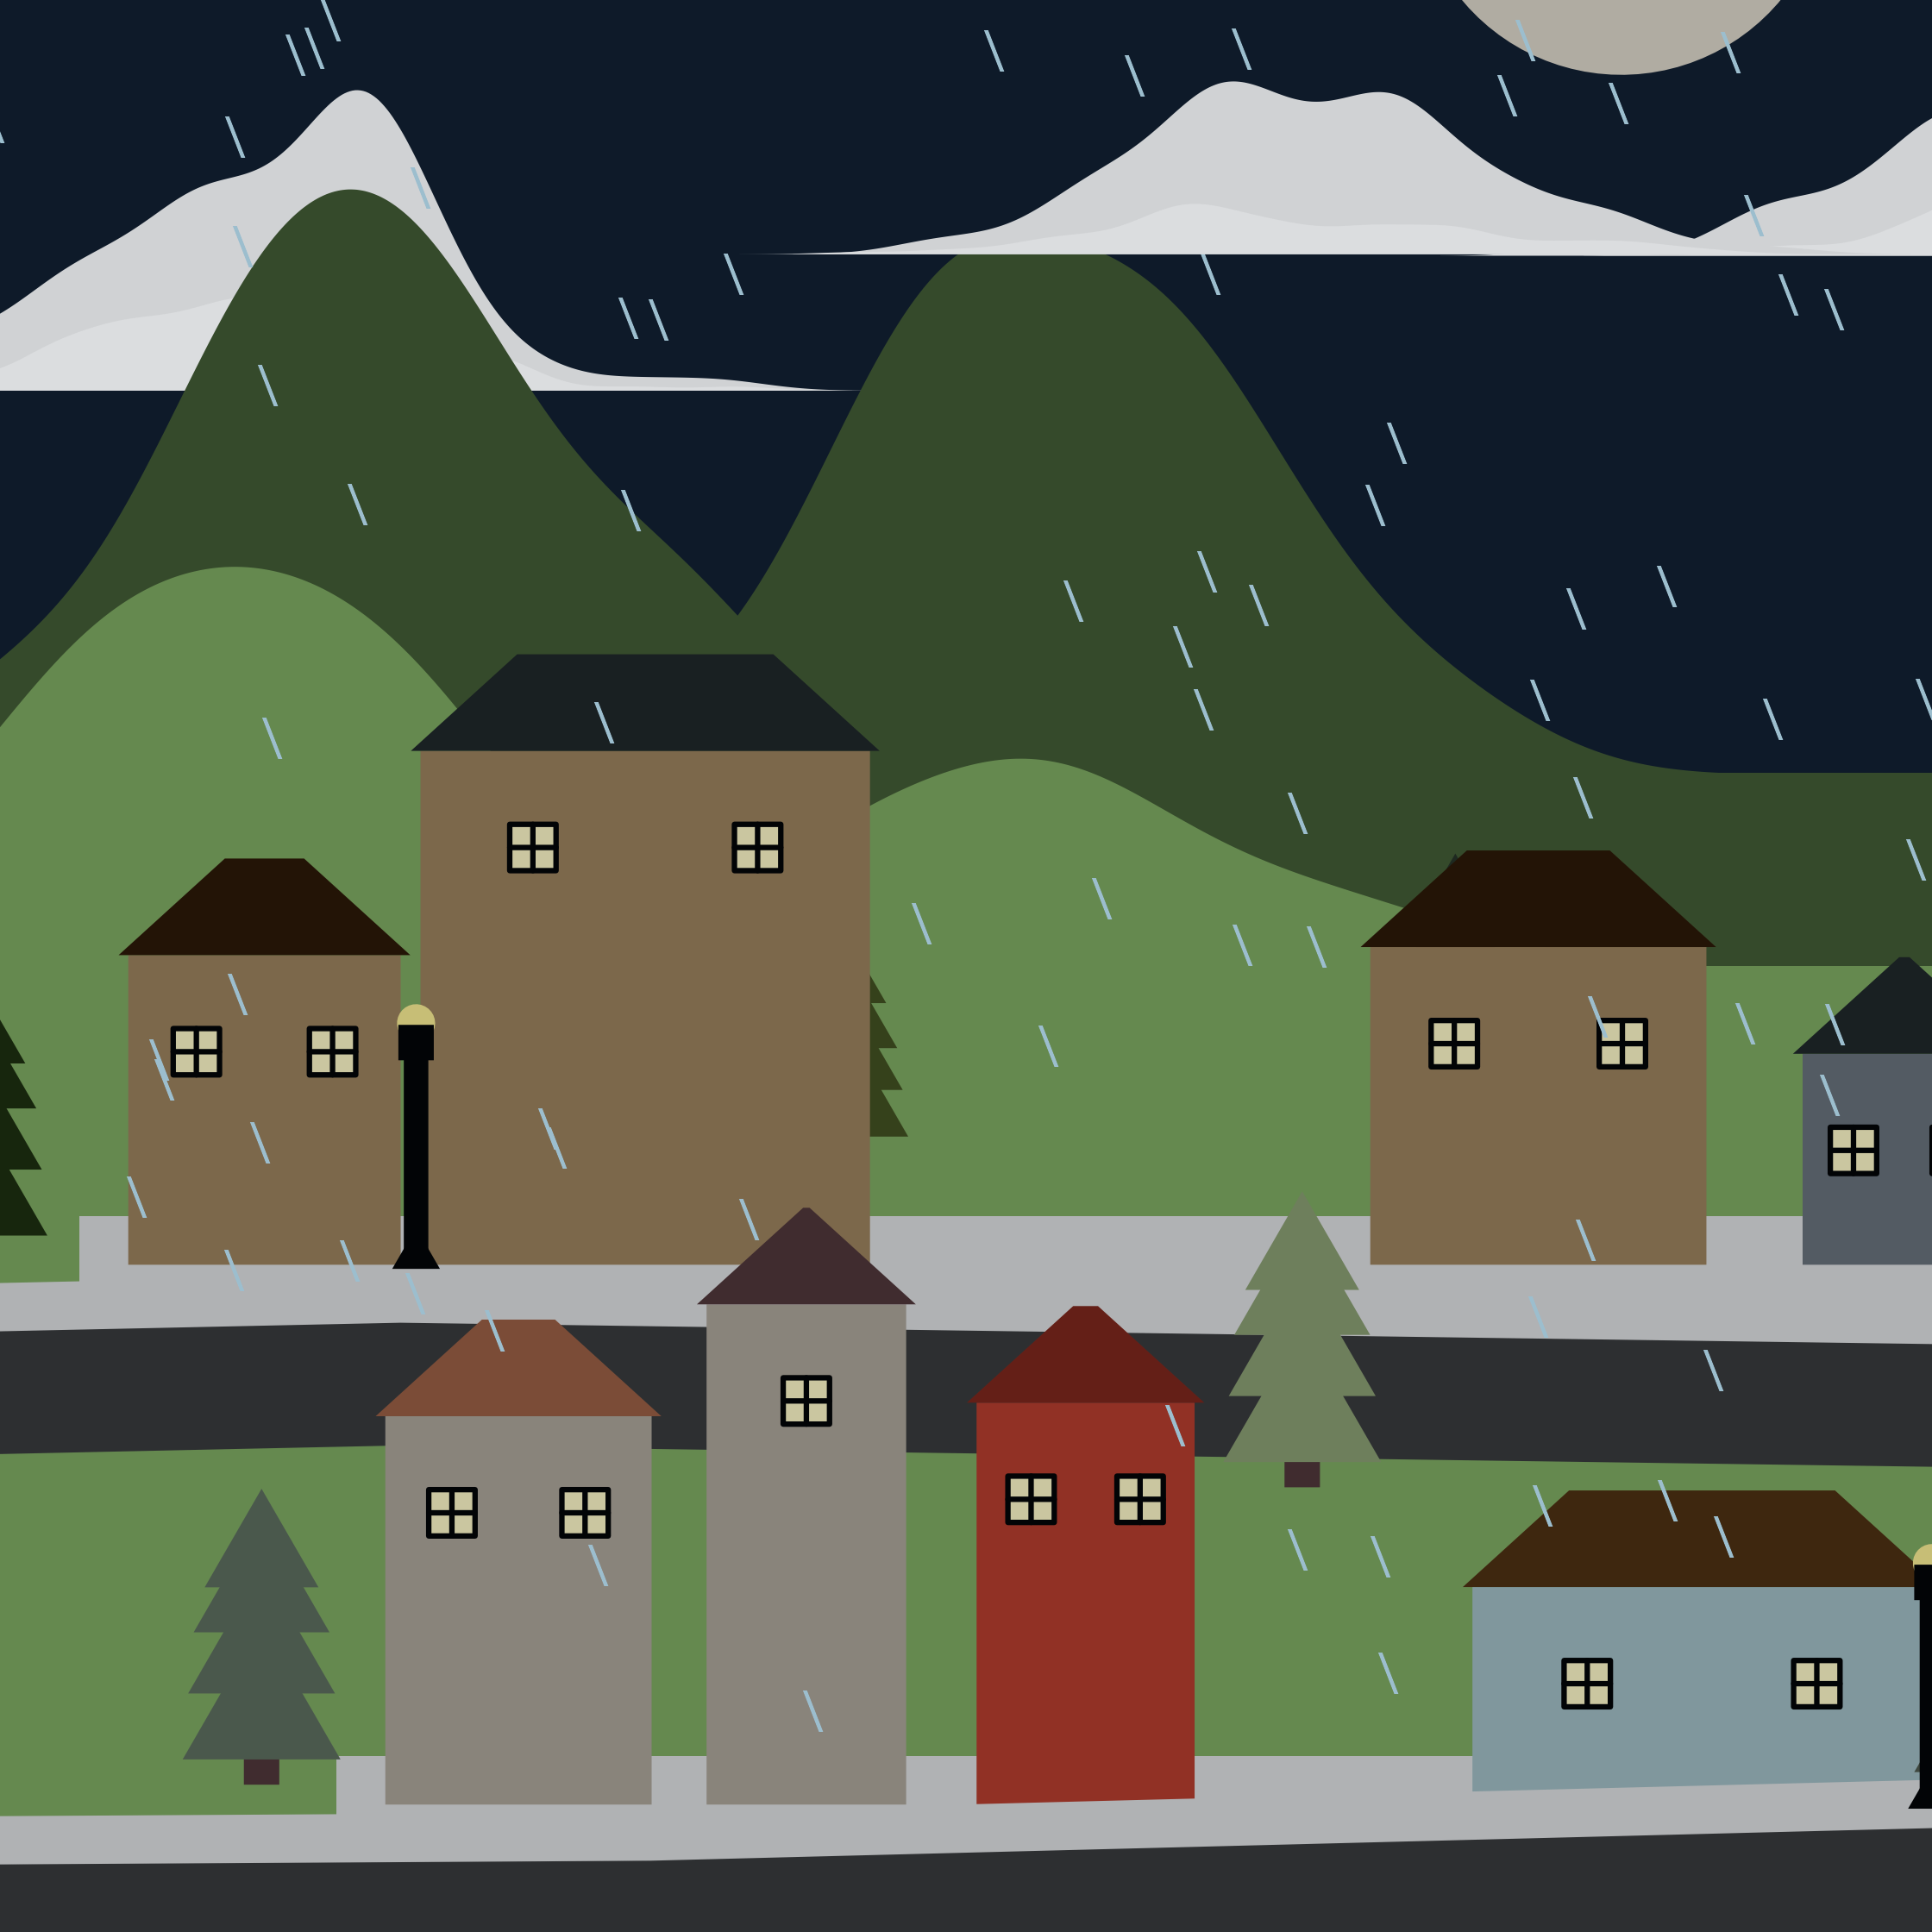
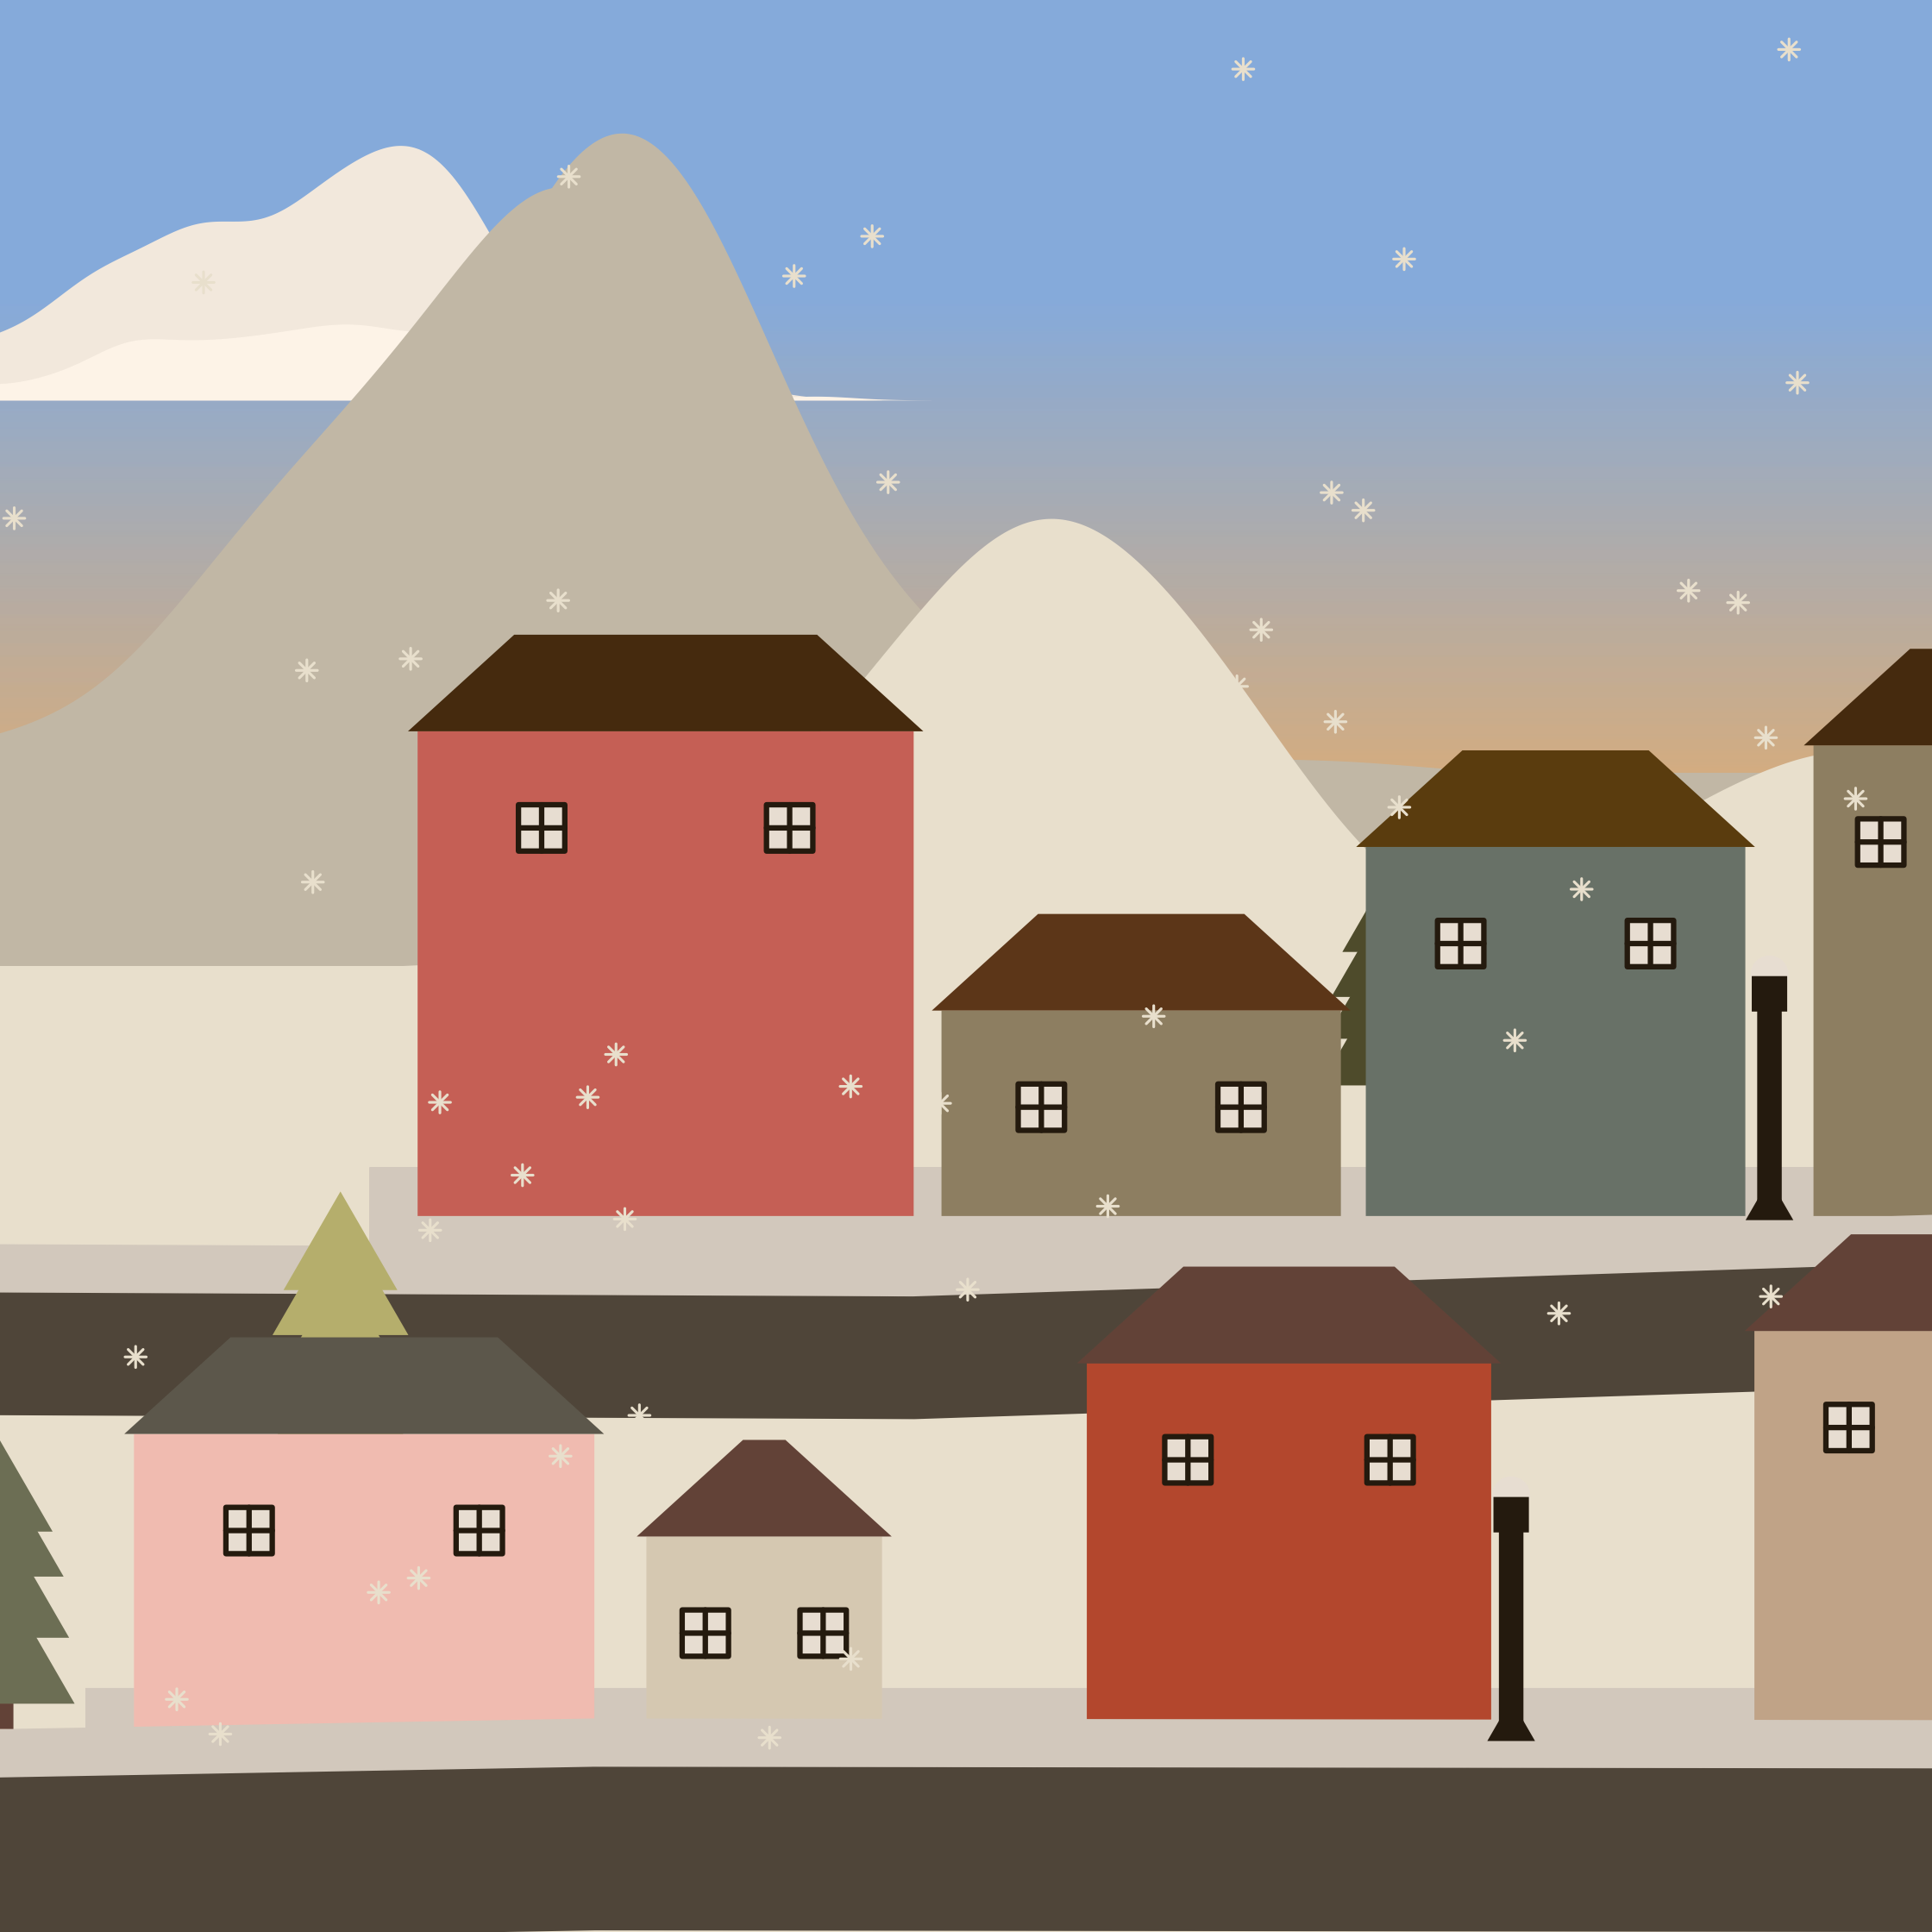
There’s also a weather system with varying degrees of rain, snow, and fog – each with different probabilities based on the type of landscape.
 {if(rand.land.df[1,1]=="snow" & snow.status == 0) geom_point(
    data = data.frame(x=rnorm(snowfall, mean =5, sd=5),
                      y=rtruncnorm(snowfall, a=1, b=10, mean=5, sd=5)),
    aes(x=x, y=y),
    pch =8, colour=rand.land.df[1,2])}
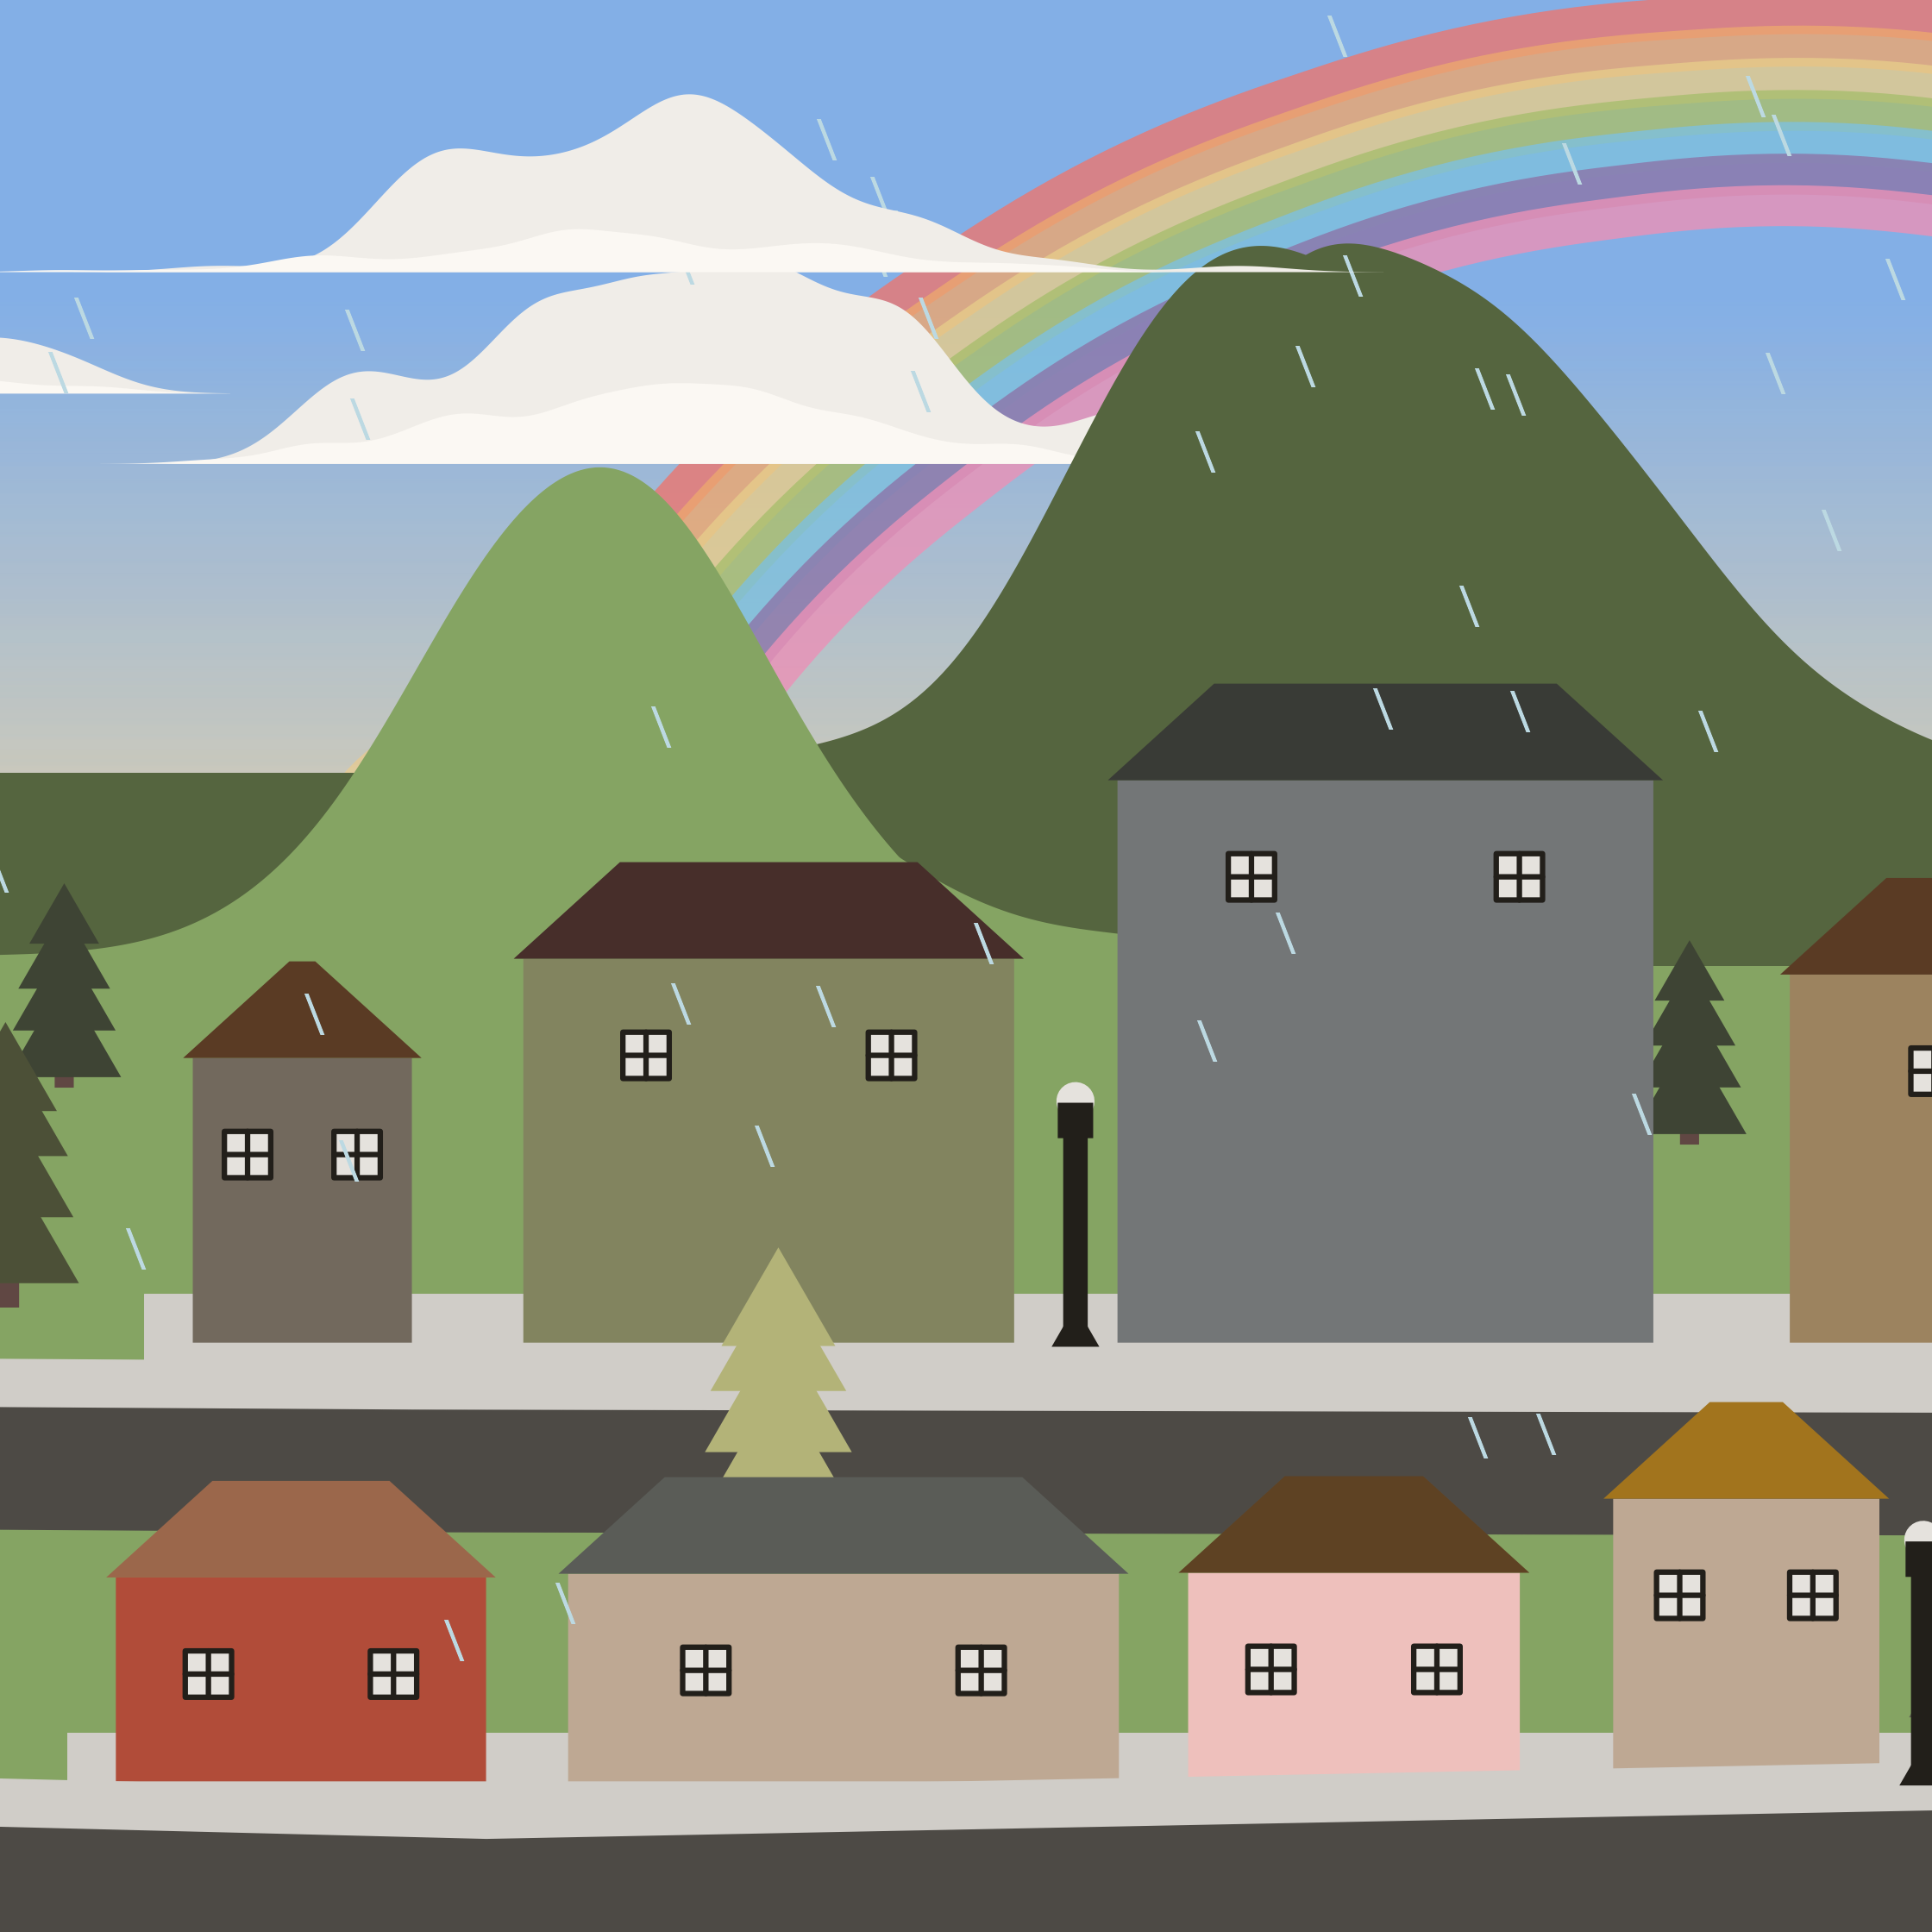
And, if you’re very lucky, you might even see a rainbow!
{if(time >=6 & time<22 & rainbow.status == 0)
    geom_curve(
  data=rainbow.df,
  aes(
  x = x,
  xend = xend,
  y = y,
  yend = y+5,
  colour=pal),
  size=5,
  curvature=runif(1,-1,-0.2),
  alpha=0.8)}+
  scale_color_identity()+
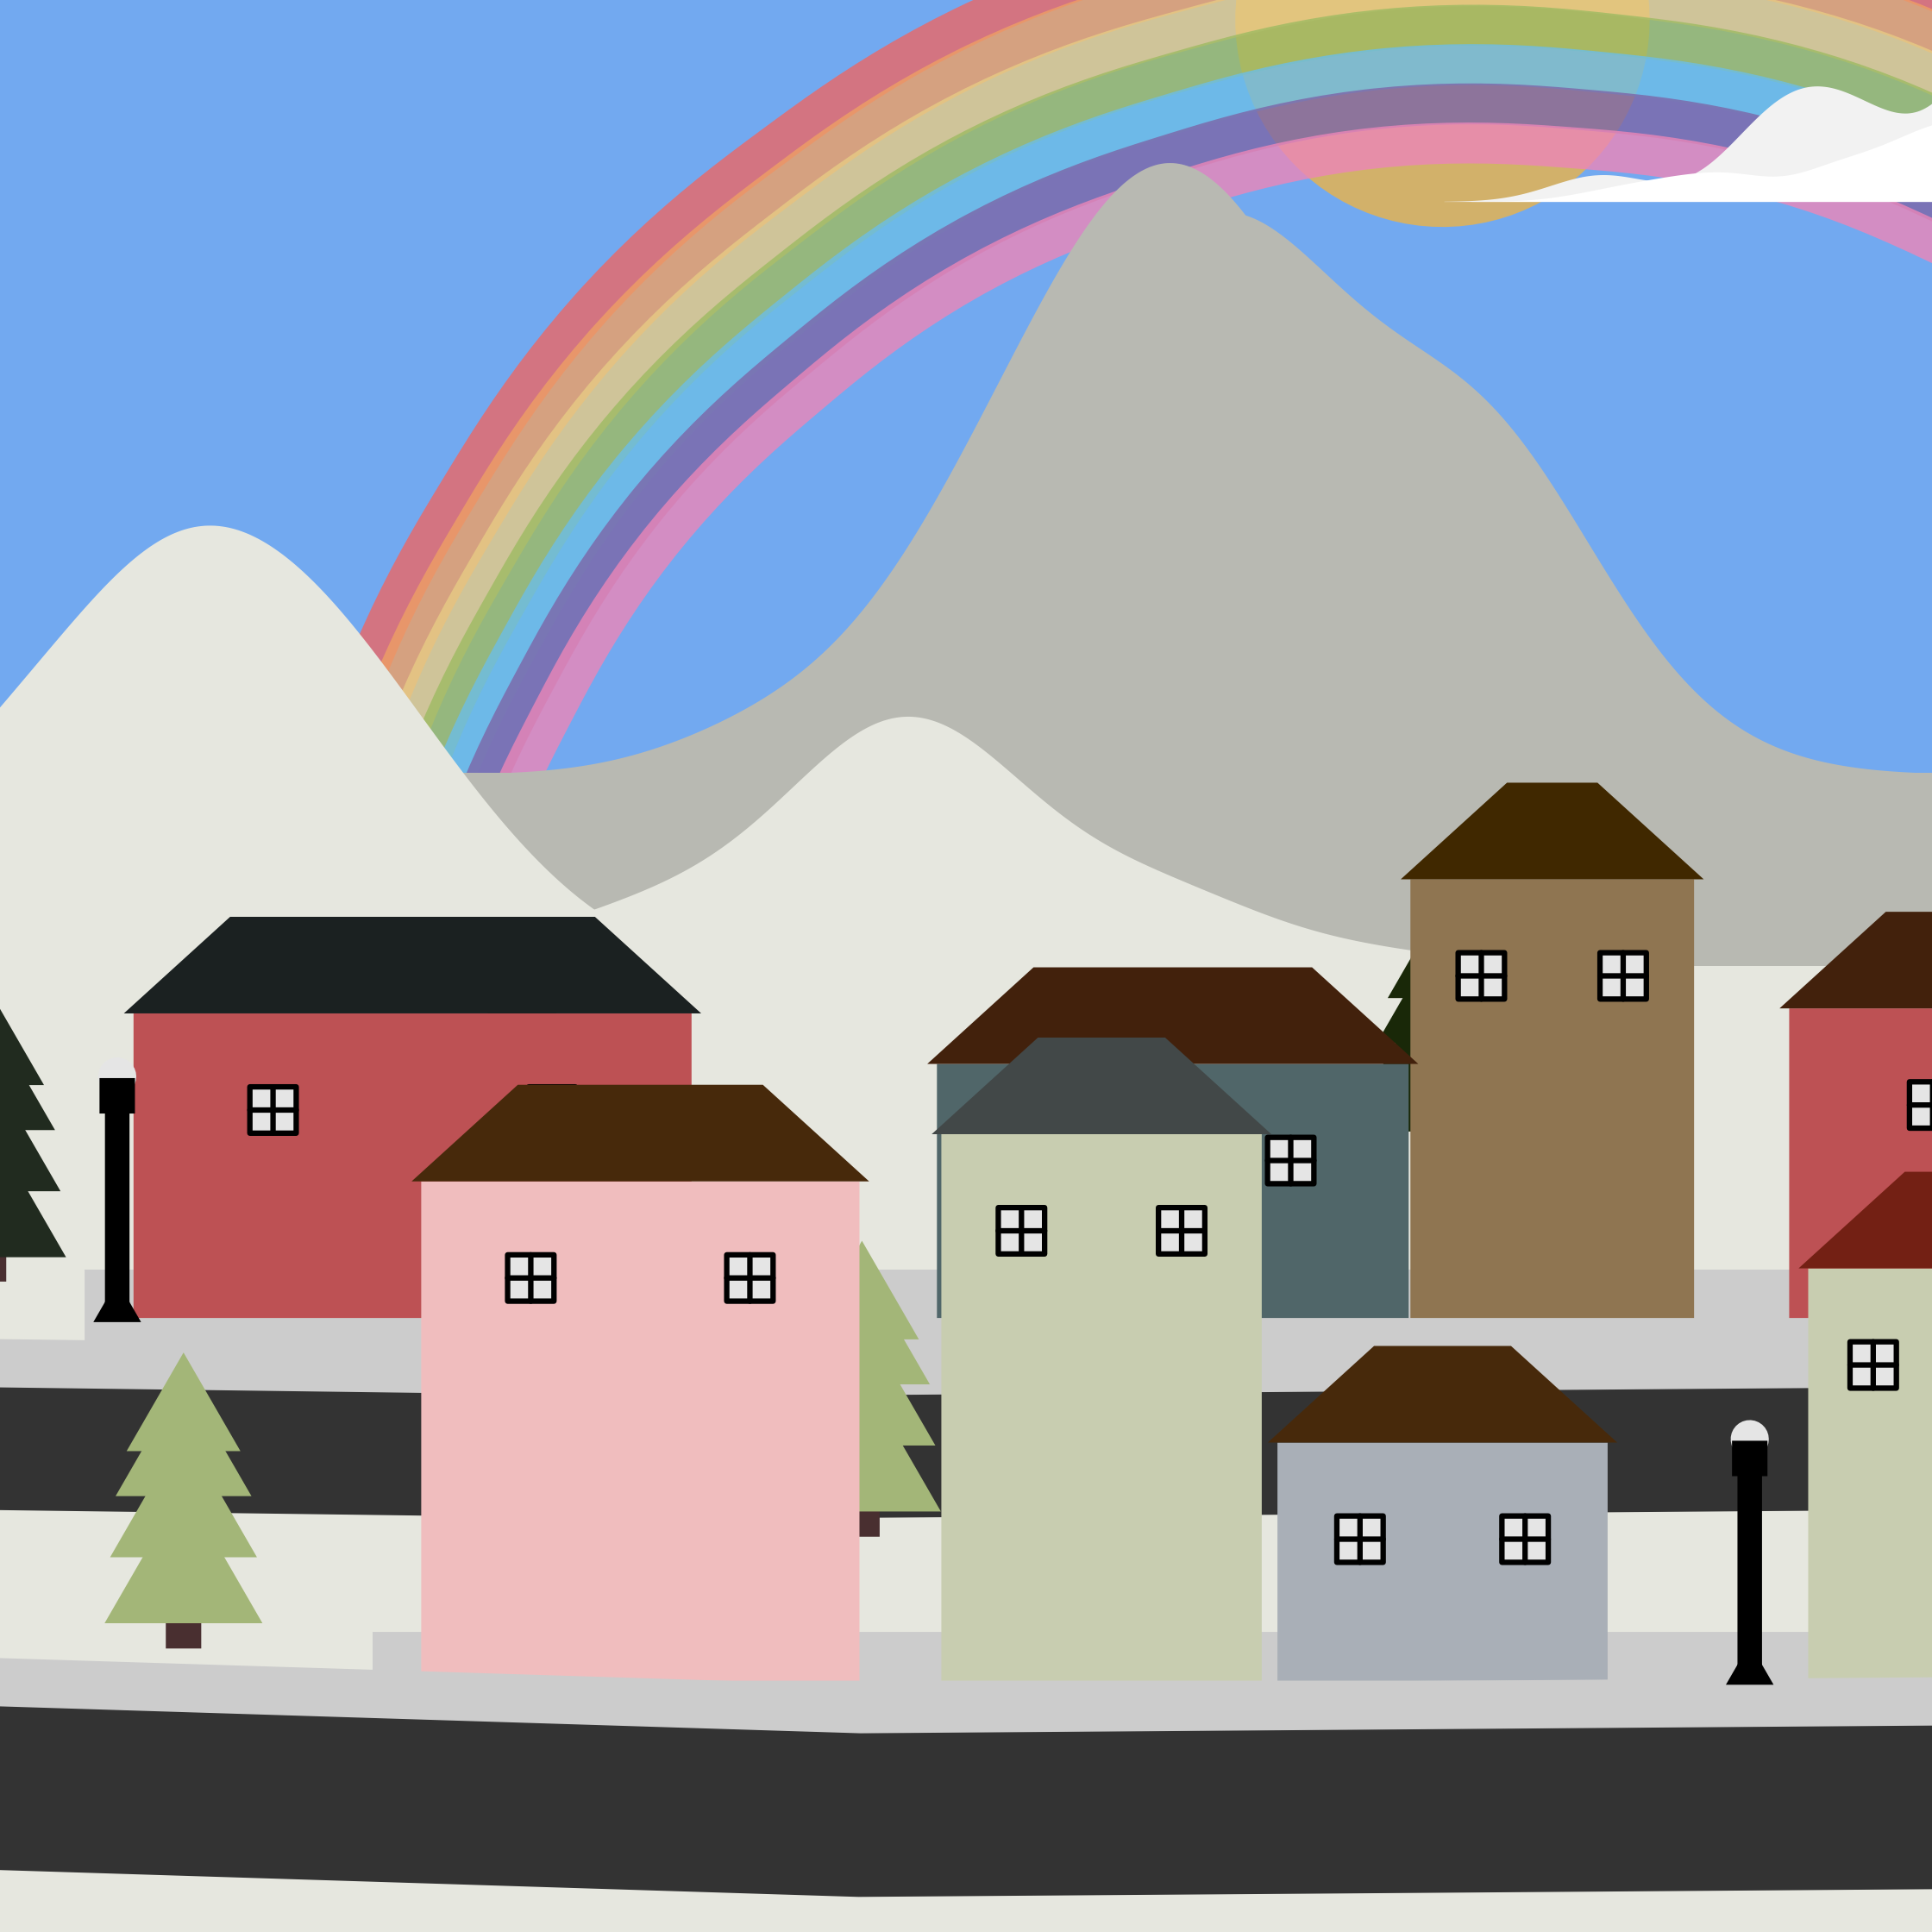
That’s pretty much it. They make for delightful Christmas cards.
geom_valley is written in R using the following packages: tidyverse, ggridges, ggfx, colorspace, scales, truncnorm.
